
Market Overview for Worldcoin/Tether (WLDUSDT): 24-Hour Technical Summary
Summary
• Price declined 2.7% on 24-hour volume of 8.18M WLD and $4.41M turnover.
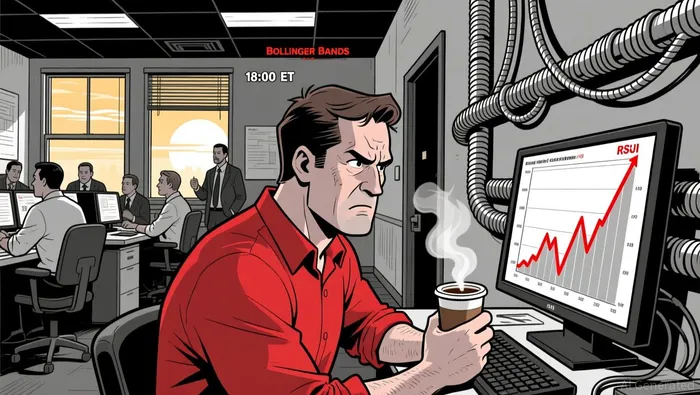
• A bearish engulfing pattern formed at 0.556–0.558 after 18:00 ET, confirming downward momentum.
• RSI (14) reached oversold levels below 30, hinting at potential near-term rebound.
• Bollinger Band contraction at 0.545–0.546 suggested a possible breakout.
Worldcoin/Tether (WLDUSDT) opened at 0.5558 at 12:00 ET − 1 and fell to a low of 0.5371 before closing at 0.5408 at 12:00 ET. The pair traded between 0.557 and 0.5371 during the 24-hour window. Total volume was 8.18 million WLD, and notional turnover reached $4.41 million.
Structure & Formations
Price tested key support levels at 0.546 and 0.545, with a bearish engulfing pattern forming at 18:00 ET confirming a shift in sentiment. A doji at 0.5453 and the 0.5455–0.5449 consolidation suggested indecision. The 0.543–0.545 zone appears to be a new near-term floor, while 0.552 and 0.556 levels may act as overhead resistance.
Technical Indicators
MACD (12,26) showed bearish divergence as it crossed below the signal line, with a negative histogram growing in magnitude. RSI (14) hit 29 at 0.5407, indicating oversold conditions, though this has not yet triggered a strong rebound. The 20-period moving average fell below the 50-period line, suggesting downward momentum could continue.
Volatility and Bollinger Bands
Bollinger Bands contracted tightly around 0.545–0.546 in the early hours of January 18, signaling a potential breakout. Price has since moved below the lower band, indicating increased bearish pressure. The expansion of the bands in the last 5 hours suggests a possible continuation of the downward move.
Volume and Turnover
The largest 5-minute turnover spike occurred at 10:00 ET when the price was at 0.5407, with $114.83 million in notional value traded. This coincided with a sharp drop from 0.5416 to 0.5407, suggesting significant selling pressure. Volume was generally aligned with the price decline, indicating no clear divergence.
Fibonacci Retracements
A 5-minute Fibonacci analysis of the 0.5581–0.5407 swing identified 0.5449 (38.2%) and 0.5419 (61.8%) as key support levels. Price found support at 0.5449 and is currently hovering near the 61.8% level, which could see renewed activity if buyers re-enter the market.
Worldcoin appears to be in a consolidation phase after breaking below key support levels. While the current bearish momentum is strong, the RSI suggesting oversold conditions and the 0.540–0.545 range acting as a magnet could mean a short-term bounce is possible. Investors should remain cautious, as a test of 0.5371 and the 0.530 psychological level could follow if bearish pressure continues.
Decoding market patterns and unlocking profitable trading strategies in the crypto space
Latest Articles
Stay ahead of the market.
Get curated U.S. market news, insights and key dates delivered to your inbox.


Comments
No comments yet