
Market Overview for World Liberty Financial USD/Tether
Summary
• Price action consolidated between 1.0003–1.0006, with bearish control emerging after 08:00 ET.
• RSI signaled oversold conditions briefly but failed to confirm a reversal.
• Volume spiked during early Asian hours, followed by a steady decline.
• Bollinger Bands showed a contraction before 08:00 ET, followed by a breakout to the downside.
• 61.8% Fibonacci retracement level at 1.0004 appeared to act as dynamic support.
Market Overview
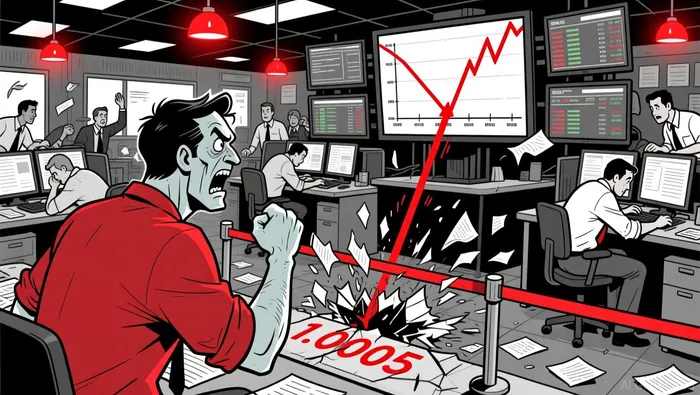
World Liberty Financial USD/Tether (USD1USDT) opened at 1.0005 on 2026-01-06 at 12:00 ET and closed at 1.0004 on 2026-01-07 at 12:00 ET, hitting a high of 1.0007 and a low of 1.0001. Total volume for the 24-hour period was 81,448,143.0, while notional turnover reached 81,461,337.40.
Price Structure and Support/Resistance
The 24-hour chart displayed a bearish bias from 08:00 ET onward, breaking below the 1.0005 psychological level. A key resistance at 1.0006 failed to hold, suggesting bearish continuation. Support was found around 1.0003–1.0004, where several candle closes clustered.
Trend and Momentum
The 20-period and 50-period moving averages on the 5-minute chart were bearish, with price settling below both. The 50-period daily MA showed a flat bias, indicating short-term bearish momentum may not necessarily align with longer-term neutrality. RSI bottomed near 30, but failed to spark a reversal, pointing to cautious bearish continuation.
Volatility and Bollinger Bands
Bollinger Bands contracted sharply between 07:00 and 08:00 ET, followed by a directional breakout to the downside. Price remained near the lower band for much of the session, suggesting elevated volatility and bearish bias.
Volume and Turnover Analysis
Volume was highest during the 08:00–09:00 ET window, with a 20M+ trade volume. However, turnover declined steadily after 10:00 ET, indicating decreasing conviction in the bearish move. A divergence between volume and price suggests caution may be warranted.
Fibonacci and Key Levels
A sharp 3.4% decline from 1.0006 to 1.0001 saw the 61.8% Fibonacci retracement level at 1.0004 hold twice, reinforcing its significance. A break below 1.0003 may target the next support at 1.0001–1.0.
The market appears to be consolidating in a tight range, with bears showing control but lacking confirmation for a deeper move. A test of 1.0001 may offer a better risk-reward entry point, though traders should be cautious of potential liquidity gaps or sudden volatility.
Decoding market patterns and unlocking profitable trading strategies in the crypto space
Latest Articles
Stay ahead of the market.
Get curated U.S. market news, insights and key dates delivered to your inbox.


Comments
No comments yet