
Market Overview for WINkLink/Tether (WINUSDT)
Summary
• WINkLink/Tether (WINUSDT) traded in a tight range, consolidating after a brief bullish attempt.
• Key resistance at $0.00003004 failed, with volume and momentum suggesting lack of conviction.
• Volatility remained subdued, with price staying inside contracting Bollinger Bands for most of the 24 hours.
• RSI and MACD showed bearish divergence, suggesting potential for near-term downside.
• Fibonacci retracement at 38.2% of the 5-minute rally served as a key pivot point for intraday traders.
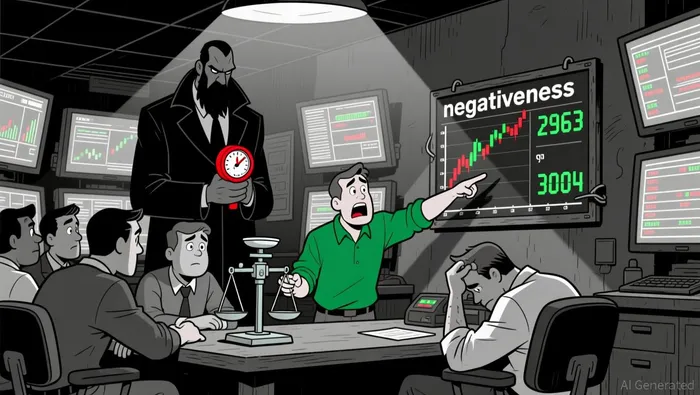
WINkLink/Tether (WINUSDT) opened at $0.00002946 on December 26, 2025, at 12:00 ET, reached a high of $0.00003068, and closed at $0.00002963 on December 27, 2025, at 12:00 ET, with a 24-hour low of $0.00002912. Total traded volume was 5,267,263,650, while notional turnover reached $155,126.11.
The pair spent most of the session within a tight range between $0.00002963 and $0.00003004, failing to break above the key resistance level of $0.00003004. A small bullish breakout attempt in the early hours saw a high of $0.00003068, but this was quickly reversed as bearish momentum regained control. The formation of bearish engulfing patterns and lower highs suggest a potential shift in sentiment.
Bollinger Bands indicated a contraction in volatility, with price spending most of the session inside the bands. The RSI dipped below 50, confirming a weakening bullish bias, while the MACD remained in negative territory, reinforcing bearish momentum. Volume saw a peak of over 936 million in the late afternoon but failed to confirm a strong move either up or down.
Fibonacci retracement levels showed that the 38.2% level of the 5-minute rally became a key resistance point, with price failing to close above it. The 61.8% level sits just below the 24-hour high and may offer limited support in the near term.
Going forward, a sustained close below $0.00002956 could signal a test of the next support level. However, traders should remain cautious, as price remains within a tight range and a breakout in either direction may occur with minimal catalyst.
Descifrar los patrones de mercado y desarrollar estrategias de negociación rentables en el ámbito de las criptomonedas.
Latest Articles
Stay ahead of the market.
Get curated U.S. market news, insights and key dates delivered to your inbox.


Comments
No comments yet