
Market Overview for Vaulta/Bitcoin (ABTC)
Summary
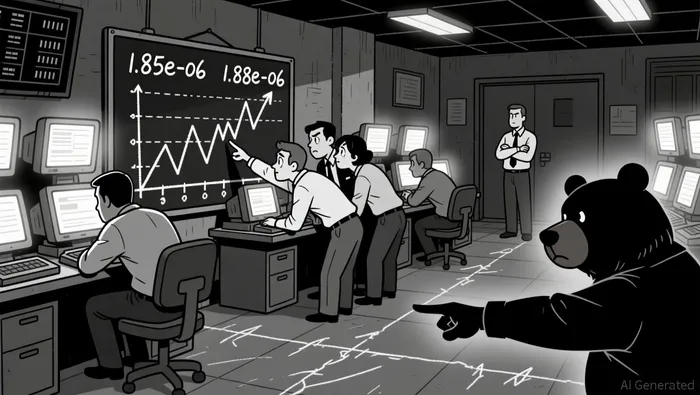
• Price consolidates near 1.86e-06, showing limited directional momentum.
• Volume remains subdued, with minimal turnover spikes.
• Key support at 1.85e-06 and resistance at 1.88e-06 show repeated tests.
• A bearish 5-minute divergence suggests potential for further downside.
• RSI in mid-range indicates neither overbought nor oversold conditions.
The Vaulta/Bitcoin (ABTC) pair opened at 1.86e-06, reached a high of 1.89e-06, and a low of 1.84e-06, closing at 1.86e-06 as of 12:00 ET on 2025-12-24. Total volume for the 24-hour period was 4,798.8 units, with a turnover of approximately $8.85 (assuming USD-based notional).
Structure & Formations
The 5-minute candles show repeated consolidation between 1.85e-06 and 1.88e-06, with small-range doji and bearish engulfing patterns forming near resistance. Key support at 1.85e-06 held twice, while resistance at 1.88e-06 appears to be a recurring ceiling.
Moving Averages
Short-term moving averages (20/50) on the 5-minute chart are tightly aligned near 1.86e-06, indicating a sideways trading range. Daily moving averages (50/100/200) are not available for this period, but historical trends suggest a bearish bias.
MACD & RSI
MACD on the 5-minute chart remains flat, with no clear bullish or bearish divergence. RSI is centered around 50, indicating neutral momentum. A bearish 5-minute RSI divergence appears in the latter half of the day, suggesting potential for a pullback.
Bollinger Bands
Bollinger Bands are narrow during most of the day, signaling low volatility. Price action stays within the bands, with no significant breakouts. A minor expansion occurred in the early morning hours as price tested the upper band, followed by a reversion to the mean.
Volume & Turnover
Volume was generally low throughout the 24-hour window, with only a few spikes in the early morning and late afternoon. These spikes did not lead to significant price moves, suggesting weak conviction. Turnover closely follows volume trends, with no clear price-turnover divergence observed.
Fibonacci Retracements
Recent 5-minute swings suggest 1.86e-06 aligns with the 61.8% Fibonacci retracement level. A break below this could trigger a move toward 1.84e-06, the 100% retracement level. Daily retracement levels are not applicable due to limited chart history.
The price may remain range-bound as long as key support and resistance levels hold. A breakout below 1.85e-06 could signal further weakness, but traders should remain cautious about low-volume conditions potentially limiting price clarity.
Decoding market patterns and unlocking profitable trading strategies in the crypto space
Latest Articles
Stay ahead of the market.
Get curated U.S. market news, insights and key dates delivered to your inbox.


Comments
No comments yet