
Market Overview for Vanar Chain/USDC (VANRYUSDC) on 2025-12-25
Summary
• Price remained range-bound near $0.0075 with no clear directional bias.
• Low volume and muted turnover suggest lack of conviction in price movement.
• A consolidation pattern emerged following a failed bullish breakout in the early hours.
• RSI remains neutral, with no signs of overbought or oversold conditions.
• Bollinger Bands show tightening volatility, signaling potential for a breakout or breakdown.
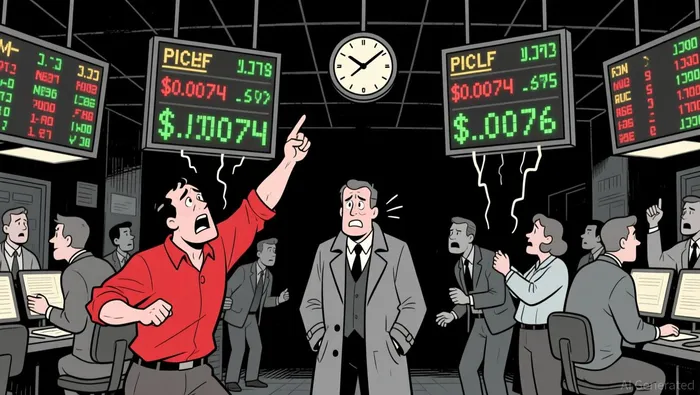
Vanar Chain/USDC (VANRYUSDC) opened at $0.0076 on December 24 at 12:00 ET, reaching a high of $0.0076 and a low of $0.0074 before closing at $0.0075 on December 25 at 12:00 ET. Total volume over the 24-hour window was 4,562,660.0, with a turnover of $34,219.95.
Structure & Formations
The price action suggests a consolidation phase between $0.0074 and $0.0076. A small bullish engulfing pattern formed briefly at 22:45 ET but failed to hold, reverting to a tight trading range. A doji appeared at 03:45 ET, indicating indecision. Support levels appear to form around $0.0074, with resistance at $0.0075–$0.0076.
Volume & Turnover
Volume spiked sharply at 22:45 ET and again at 02:45 ET and 03:00 ET, but these spikes failed to confirm strong price direction. Turnover increased during these periods but remained relatively low overall. Divergences between volume and price suggest traders are not committing to a directional bias.
MACD & RSI
The RSI hovered around 50, showing no signs of overbought or oversold conditions, consistent with a sideways trend. The MACD line remained flat, with no clear divergence from the price, indicating that momentum has been neutral to weak over the past 24 hours.
Bollinger Bands
Bollinger Bands have narrowed over the past 6 hours, pointing to a potential increase in volatility. Price remains close to the mid-band, suggesting that the market is in a period of consolidation. A breakout from the current range could be expected if the bands expand and price moves toward one of the extremes.
Fibonacci Retracements
Applying Fibonacci levels to the minor 5-minute swing from $0.0074 to $0.0076 shows that the price has bounced off the 38.2% retrace level and is now hovering near the 50% level. A break below $0.0074 could test the 61.8% retrace level, but no major Fibonacci levels from the daily chart are in play at this moment.
The market may continue to trade in a tight range for the next 24 hours, with limited directional movement. Traders should remain cautious about entering long or short positions without a clear breakout. A break below $0.0074 or above $0.0076 could trigger increased volatility, but a continuation of the current range is also likely.
Descifrar los patrones de mercado y desarrollar estrategias de trading rentables en el ámbito de las criptomonedas.
Latest Articles
Stay ahead of the market.
Get curated U.S. market news, insights and key dates delivered to your inbox.


Comments
No comments yet