
Market Overview for Vana/USDC (VANAUSDC)


Summary
• VANAUSDC formed a bullish breakout above 2.66 with high volume in late evening trading.
• RSI surged to 68, suggesting rising momentum but not yet overbought.
• Bollinger Bands expanded after a contraction, reflecting renewed volatility.
• Key support held at 2.62, with a potential test expected at 2.60–2.62.
Vana/USDC (VANAUSDC) opened at 2.632 on 2025-12-17 12:00 ET, reached a high of 2.735, a low of 2.597, and closed at 2.602 on 2025-12-18 12:00 ET. Total 24-hour volume was 8,737.29, and turnover was approximately $22,825.
Structure & Formations
Price formed a bullish breakout above 2.66 on strong volume during the late evening session, followed by a consolidation phase near 2.70–2.735. A bearish reversal candle emerged around 2.693–2.606 in the early morning, suggesting potential near-term resistance at 2.71–2.72 and support at 2.60–2.62. A key 5-minute doji near 2.66 at 00:00 ET highlighted indecision in early trading.
Moving Averages and Momentum
Short-term 20-period and 50-period moving averages on the 5-minute chart were above the price for much of the day, reflecting bullish momentum early on. 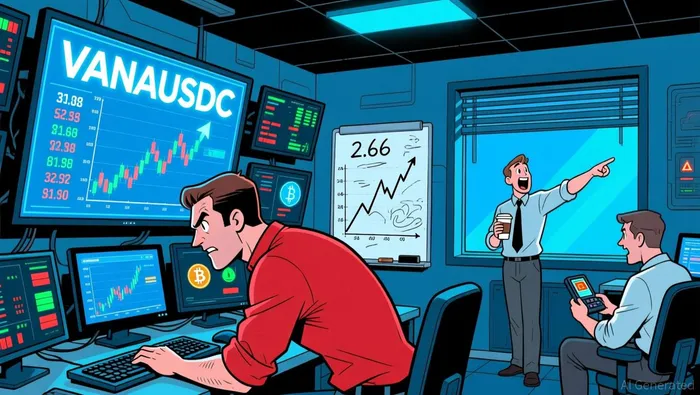 The RSI rose to 68 by 22:30 ET, suggesting strong buying pressure but not yet overbought. MACD showed a positive crossover in the evening, reinforcing the bullish trend, though divergence began to appear in the final hours of the session.
Volatility and Volume
Bollinger Bands experienced a notable contraction around 2.65–2.665 before expanding during the breakout, signaling a shift in volatility. High volume and turnover spikes occurred between 19:30 and 22:30 ET, with a total of $1,300 in turnover in the 22:30 ET 5-minute bar alone. Volume declined significantly in the final 4 hours, indicating reduced conviction.
Fibonacci Retracements
On the 5-minute chart, key Fibonacci levels from the 2.62–2.735 swing were at 2.68 (38.2%) and 2.65 (61.8%), both of which acted as temporary levels of interest. On the daily chart, a major retracement at 2.64–2.66 may offer near-term support if the current bearish pressure continues.
VANAUSDC appears poised for a test of 2.60–2.62 in the next 24 hours. While short-term momentum remains positive, traders should monitor for a potential pullback or reversal if volume fails to confirm the breakout. Volatility and divergences may signal a shift in sentiment.
Decoding market patterns and unlocking profitable trading strategies in the crypto space
Latest Articles
Stay ahead of the market.
Get curated U.S. market news, insights and key dates delivered to your inbox.


Comments
No comments yet