
Market Overview for Vana/USDC on 2025-12-14


Summary
• VANAUSDC posted a bullish reversal pattern on 5-min chart, rebounding from 2.85 to 2.902 before consolidating.
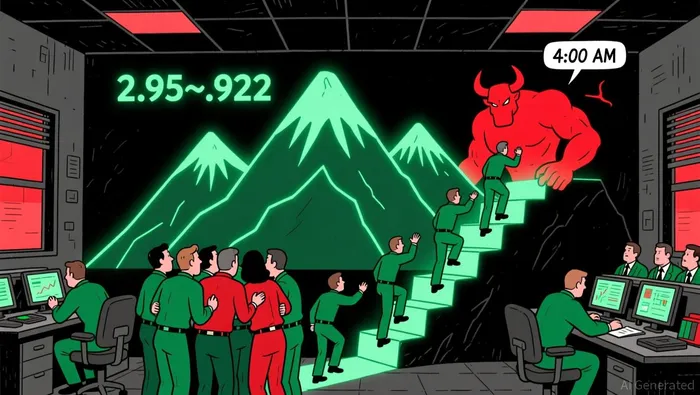
• Volume spiked at 2.95–2.922 level, confirming short-term resistance.
• RSI moved into overbought territory near 70, suggesting potential near-term pullback.
• Bollinger Bands showed widening volatility after midday consolidation.
• Turnover surged overnight, with divergent price action seen after 04:00 ET.
Vana/USDC (VANAUSDC) opened at 2.852 on 2025-12-13 12:00 ET, hit a high of 2.982, a low of 2.85, and closed at 2.869 on 2025-12-14 12:00 ET. The 24-hour volume was 7,394.87, with a notional turnover of $21,030.
Structure & Formations
The 24-hour candle formed a wide-range bullish recovery pattern, especially between 2.85 and 2.982. A key resistance was confirmed at 2.95–2.922, where price stalled multiple times. A bearish engulfing pattern at 04:00 ET suggested short-term bearish momentum.
Moving Averages
On the 5-minute chart, the 20-period and 50-period moving averages crossed twice in the morning, indicating a temporary bullish crossover.
 On daily timeframe, the 50-period MA sits below the 200-period MA, suggesting bearish bias over the longer term.
 Momentum & Volatility
RSI climbed into overbought territory (70+) by 21:45 ET, suggesting potential correction. MACD showed a bullish divergence during the overnight rally, but momentum weakened after 04:00 ET. Bollinger Bands expanded significantly during the late-night surge, indicating rising volatility.
Volume & Turnover
Volume spiked at 2.95–2.922 (995.27), suggesting strong resistance. Overnight turnover surged, but price failed to maintain the higher levels, indicating possible short-term profit-taking. Divergence between volume and price after 04:00 ET hints at weakening bullish conviction.
Fibonacci Retracements
On the 5-minute chart, the 61.8% retracement level of the 2.85–2.982 move sits at 2.915, which price briefly touched before consolidating. This level could serve as a potential pivot point in the coming 24 hours.
VANAUSDC appears to have consolidated after a strong overnight rally, but key resistance at 2.95–2.922 may cap further gains in the near term. The next 24 hours could bring a test of support around 2.86–2.85, with a risk of a deeper pullback if bears regain control after 2.915. Investors should watch for divergence in volume and momentum indicators to confirm directional bias.
Decoding market patterns and unlocking profitable trading strategies in the crypto space
Latest Articles
Stay ahead of the market.
Get curated U.S. market news, insights and key dates delivered to your inbox.


Comments
No comments yet