
Market Overview for Usual/Tether (USUALUSDT): Volatility and Oversold Momentum
Summary
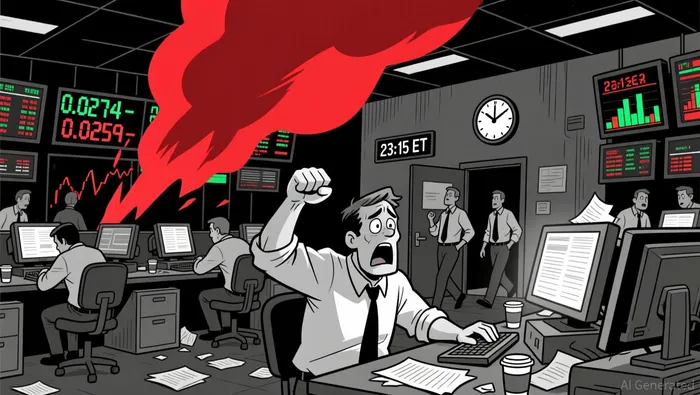
• Price action saw a sharp 3.6% decline from 0.0274 to 0.0263 on 2026-01-12.
• Volatility expanded mid-session, with a key swing low forming at 0.0259.
• On-balance volume spiked at 0.0264, indicating potential short-term support.
• RSI and MACD signaled oversold conditions, hinting at near-term rebound potential.
At 12:00 ET − 1 on 2026-01-11, Usual/Tether (USUALUSDT) opened at 0.0274, hit a high of 0.0275, and a low of 0.0259 before closing at 0.0263 at 12:00 ET on 2026-01-12. The 24-hour volume totaled 19.2 million, with a notional turnover of approximately $511,800.
Structure & Formations
Price tested a key support level near 0.0263-0.0264 multiple times, forming a small base. A large bearish candle at 23:15 ET (0.0264 high to 0.0259 low) suggested a shift in sentiment.
Moving Averages
The 20-period and 50-period SMAs on the 5-minute chart both crossed below the price, reinforcing the downward trend. Daily averages (50/100/200) were not directly calculable without full daily data, but the trend appears bearish over the last 48 hours.
MACD & RSI
The MACD turned negative with a narrowing histogram, suggesting fading bearish momentum. RSI dipped into oversold territory near 30, implying potential for a short-term bounce.
Bollinger Bands
Volatility spiked following the 23:15 ET selloff, with price hitting the lower band at 0.0259. The bands were wide, indicating increased market uncertainty.
Volume & Turnover
Volume spiked near the 0.0264 level, confirming this as a potential support zone. Turnover aligned with the price action, showing no divergence.
Fibonacci Retracements
A 38.2% Fibonacci retracement level lies near 0.0263, aligning with a potential near-term floor. A 61.8% retracement is at 0.0267, which could become a re-entry resistance.
While the oversold RSI and supportive volume suggest a potential bounce from 0.0263–0.0264, a break below this level could trigger further selling. Investors should monitor volume and order flow for signs of reversal or continuation over the next 24 hours.
Descifrar patrones de mercado y desarrollar estrategias de negociación rentables en el ámbito de las criptomonedas.
Latest Articles
Stay ahead of the market.
Get curated U.S. market news, insights and key dates delivered to your inbox.

AInvest
PRO
AInvest
PRO
Comments
No comments yet