
Market Overview: USDC/Tether (USDCUSDT) 24-Hour Summary
Summary
• Price fluctuated tightly between 1.0003 and 1.0006 with no clear directional bias.
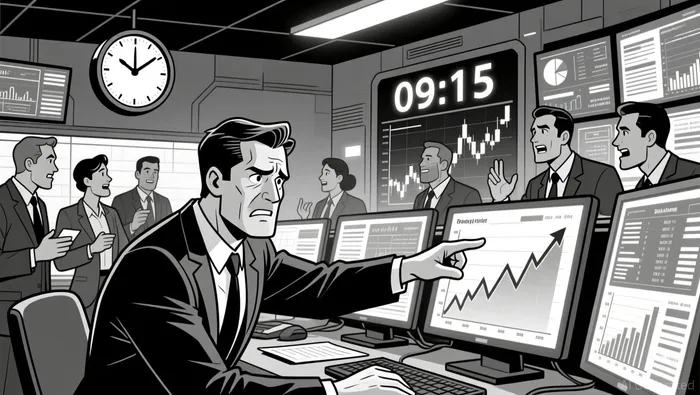
• Volume spiked dramatically at 09:15 ET, coinciding with a minor pullback in price.
• RSI remained in mid-range territory, suggesting balanced buying and selling pressure.
• Bollinger Bands remained narrow, indicating low volatility and potential for a breakout.
USDC/Tether (USDCUSDT) opened at 1.0006 on 2025-12-26 12:00 ET, reached a high of 1.0006, a low of 1.0003, and closed at 1.0003 on 2025-12-27 12:00 ET. Total volume traded over 24 hours was approximately 608.1 million units, with notional turnover of ~$608.4 million.
Structure & Formations
The pair moved within a narrow range, with support forming at 1.0003 and resistance at 1.0006. A key 5-minute bearish engulfing pattern appeared at 09:15 ET, which coincided with a sharp increase in volume. This formation may suggest a temporary rejection of higher prices, but without a clear break below the support level, continuation within the range appears likely.
Moving Averages
On the 5-minute chart, the 20- and 50-period moving averages remained closely aligned, reflecting the tight trading action. Daily moving averages (50/100/200) also showed little divergence, reinforcing the stability of the peg between USDCUSDC-- and TetherUSDT--.
MACD & RSI
The MACD histogram showed a flat profile, consistent with the lack of directional momentum. RSI hovered around 50 for most of the 24-hour period, signaling equilibrium between buyers and sellers. A brief oversold condition near 1.0003 was observed, but it failed to trigger a sustained rebound.
Bollinger Bands
Bollinger Bands remained contracted, indicating low volatility. Price action stayed within the bands, with no significant breakouts. The narrow banding could suggest an accumulation phase or preparation for a potential move outside the range in the near term.
Volume & Turnover
The largest volume spike occurred at 09:15 ET (36.7 million units traded), coinciding with a pullback from the intraday high. Turnover increased by ~$36.7 million at that point, suggesting a meaningful shift in interest. However, price failed to follow through, indicating possible profit-taking or a lack of conviction in the short-term direction.
Fibonacci Retracements
On the 5-minute chart, the pullback to 1.0003 aligned with the 38.2% Fibonacci retracement level from the morning high. The failure to break below this level suggests potential support. On the daily chart, Fibonacci levels remain largely irrelevant due to the stable peg between the two stablecoins.
Price may remain range-bound in the coming 24 hours unless a stronger catalyst emerges. Traders should watch for a break above 1.0006 or below 1.0003 to confirm the next directional move.
Decoding market patterns and unlocking profitable trading strategies in the crypto space
Latest Articles
Stay ahead of the market.
Get curated U.S. market news, insights and key dates delivered to your inbox.


Comments
No comments yet