
Market Overview: Four/USDC (FORMUSDC) – 24-Hour Analysis


Summary
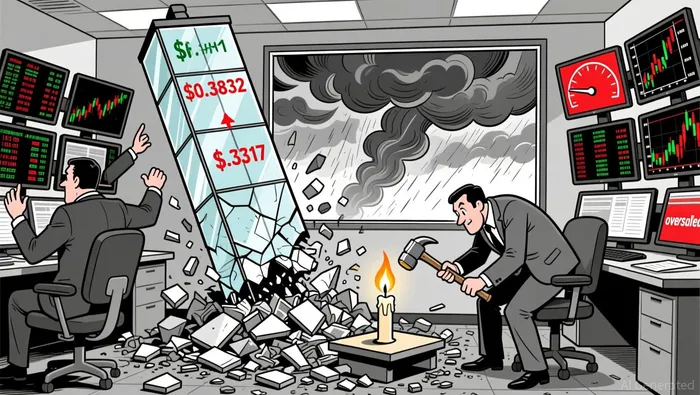
• Price declined sharply from $0.3831 to $0.3317, forming a bearish breakdown from key resistance.
• RSI reached oversold levels around $0.332–$0.334, suggesting potential short-term bounce.
• Volume surged during the drop, confirming bearish sentiment but hinting at exhaustion.
• Bollinger Bands widened with price near the lower band, indicating high volatility.
• A bullish hammer formed at the session close, signaling possible near-term reversal.
Market Overview
Four/USDC (FORMUSDC) opened at $0.3831 on 2025-12-17 at 12:00 ET and closed at $0.3351 on 2025-12-18 at 12:00 ET, with a low of $0.3317 and high of $0.3831. Total 24-hour volume reached approximately 859,666.9 units, with turnover of roughly $279,928.
The price formation showed a clear bearish bias, with a breakdown from the key 0.3802–0.3809 resistance into a new intraday low. A hammer candle at the close near 0.3332 suggests a short-term stabilization. RSI readings dropped to oversold territory (~30) during the decline, hinting at potential buying interest.
MACD showed a bearish crossover with negative momentum, aligning with the price drop. Bollinger Bands reflected increased volatility, with price touching the lower band and showing a possible bounce. Volume was elevated during the decline but started to contract as price stabilized, which could indicate a short-term pause in the downward move.
Fibonacci retracement levels from the 0.3831 high to the 0.3317 low indicate potential support at 38.2% (~0.3550) and 61.8% (~0.3600). If buyers hold at 0.3317–0.3324, a test of these levels may follow.
Looking ahead, traders should watch for a breakout above 0.3429–0.3435 for renewed bullish momentum, but bearish continuation remains probable if the 0.3317 level breaks again. Investors should remain cautious given the heightened volatility and mixed momentum signals.
Decoding market patterns and unlocking profitable trading strategies in the crypto space
Latest Articles
Stay ahead of the market.
Get curated U.S. market news, insights and key dates delivered to your inbox.


Comments
No comments yet