
Market Overview for Uniswap/Tether (UNIUSDT)
Summary
• Price tested key resistance near 5.525 before retracing lower to 5.474.
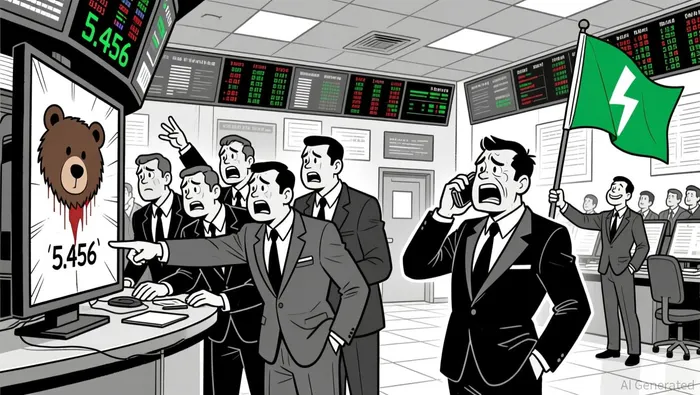
• High volatility seen after midday ET as price dropped to 5.456.
• Volume surged during the decline, confirming bearish momentum.
• RSI entered oversold territory, hinting at potential short-term bounce.
• Bollinger Bands widened significantly, indicating increased market uncertainty.
At 12:00 ET–1, Uniswap/Tether (UNIUSDT) opened at 5.506, reached a high of 5.538, and hit a low of 5.445 before closing at 5.502. The 24-hour volume totaled 1,218,693.78 and turnover amounted to $6,730,574.65.
Structure & Formations
Price action on the 5-minute chart revealed a significant bearish engulfing pattern at 5.525, followed by a long lower wick at 5.456, signaling rejection at key support. A bullish doji emerged near 5.474, suggesting temporary equilibrium and potential for a rebound.
Moving Averages
On the 5-minute chart, price briefly crossed above the 20-period MA but remained below the 50-period MA. Daily moving averages show a mixed picture with the 50-period line at 5.500 and the 200-period at 5.468, suggesting a consolidation phase may be forming.
MACD & RSI
MACD turned negative after midday, confirming bearish momentum, while RSI entered oversold territory (30–35), hinting at a potential reversal or pullback. The divergence between price and RSI suggests caution in short-term bearish assumptions.
Bollinger Bands
Volatility expanded significantly as price dropped to 5.456, with the bands widening to their widest point during the 24-hour window. Price currently sits near the lower band, increasing the chance of a near-term bounce.
Volume & Turnover
Volume spiked during the midday sell-off, particularly at 5.456, with turnover surging to over $405,000 in the hour ending at 16:00 ET. The divergence between price and volume during the rebound near 5.474 suggests weak conviction.
Fibonacci Retracements
The 5.474 level aligns with the 61.8% retracement of the recent 5-minute bullish swing. On the daily chart, a key support level appears at the 38.2% level of the larger move from 5.445 to 5.538, currently at 5.495.
The price may consolidate near the 5.500 level before deciding the next direction. While the oversold RSI suggests a bounce could materialize, bearish volume dynamics remain a risk for further downside. Investors should monitor for a breakout above 5.525 or a breakdown below 5.474 for stronger directional signals.
Decoding market patterns and unlocking profitable trading strategies in the crypto space
Latest Articles
Stay ahead of the market.
Get curated U.S. market news, insights and key dates delivered to your inbox.


Comments
No comments yet