
Market Overview for TUSDUSDT: 24-Hour TrueUSD/Tether Stability Amid Low Volatility
Summary
• Price fluctuated between 0.9998 and 1.0004, forming a tight consolidation pattern.
• High volume surges appeared near 1.0001, suggesting key liquidity or order book pressure.
• MACD showed a flat line, while RSI hovered near 50, signaling mixed momentum.
• Bollinger Bands remained narrow, indicating low volatility and potential for a breakout.
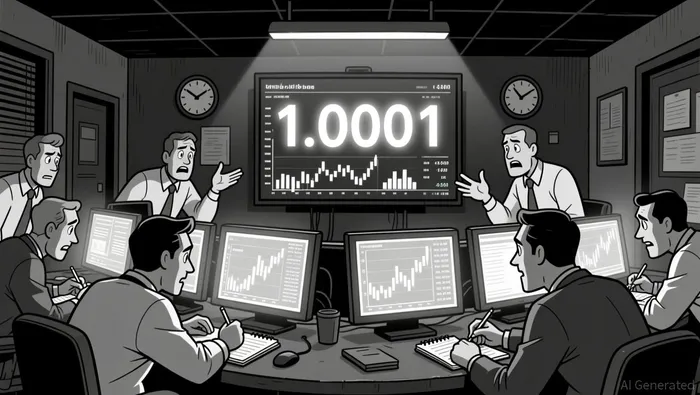
TrueUSD/Tether (TUSDUSDT) opened at 1.0 on 2026-01-16 at 12:00 ET and traded between 0.9998 and 1.0004 over the next 24 hours, closing at 1.0001 by 12:00 ET the following day. Total volume reached 33,326.0, with a notional turnover of 33,317.99.
Structure & Formations
The 5-minute candles displayed a tight trading range, with price repeatedly testing 1.0001 as a key pivot point. Several neutral patterns—such as doji and spinning tops—emerged near this level, suggesting indecision. No clear bullish or bearish engulfing patterns were observed.
Moving Averages and Bollinger Bands
A 20-period and 50-period EMA on the 5-minute chart aligned closely near 1.0001, reinforcing the idea of a stable equilibrium. Bollinger Bands remained narrow for most of the period, indicating low volatility. Price spent much of its time near the middle band, with minor deviations toward the upper and lower boundaries suggesting limited directional bias.
Momentum and Volatility
RSI oscillated around 50, with no strong overbought or oversold signals, and the MACD line remained flat. This suggests that while there was short-term fluctuation, overall momentum was neutral.
Volume and Turnover
Volume spiked at several points near 1.0001, particularly during the 21:45–22:00 ET and 13:30–13:45 ET intervals, indicating potential liquidity clusters. However, there was no significant divergence between price and volume, which suggests that these moves were largely in line with market expectations.
Looking ahead, the price may continue to consolidate near 1.0001 in the absence of macroeconomic catalysts or order-book imbalances. A break above 1.0004 or below 0.9998 could indicate a shift in sentiment, but traders should remain cautious as low volatility increases the risk of false breakouts.
Decoding market patterns and unlocking profitable trading strategies in the crypto space
Latest Articles
Stay ahead of the market.
Get curated U.S. market news, insights and key dates delivered to your inbox.


Comments
No comments yet