
Market Overview for TRON/XRP (TRXXRP) on 2026-01-10
Summary
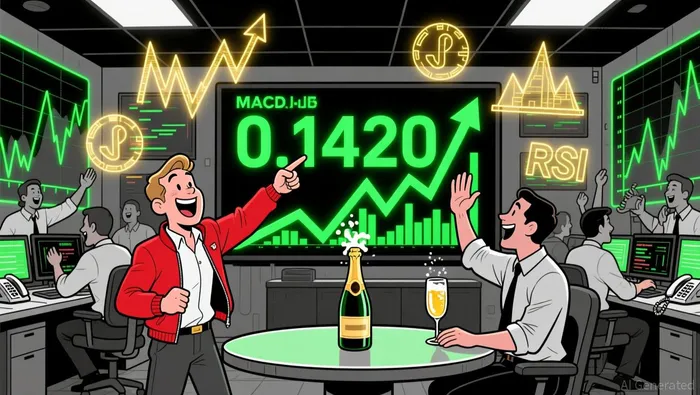
• Price formed bullish engulfing patterns near 0.1420, followed by consolidation above key support.
• Volume spiked during the 18:15–18:30 ET window, confirming upward momentum.
• RSI indicated overbought conditions near 65–70, with no clear divergence from price.
• Bollinger Bands showed moderate volatility, with price hovering just above the midline.
• A 38.2% Fibonacci retracement level at ~0.1423 supported the consolidation phase.
The TRON/XRP (TRXXRP) pair opened at 0.1394 (12:00 ET–1) and closed at 0.1428 (12:00 ET), reaching a high of 0.1432 and a low of 0.1394. Total volume across the 24-hour window was 2,377,701.8, and notional turnover was 339,446.39.
Structure & Formations
Price tested and held above 0.1420 during the 17:30–18:00 ET window, forming bullish engulfing patterns that signaled a reversal from earlier bearish pressure. Key resistance appears to be forming around 0.1430–0.1432, with support consolidating at 0.1420–0.1423.
Trend Indicators and Momentum
The 20-period and 50-period moving averages on the 5-minute chart were trending upward, aligning with the bullish price action. MACD showed positive divergence during the 18:15–18:30 ET window, supporting the idea of strengthening momentum. RSI reached overbought territory multiple times, suggesting the potential for a short-term pullback.
Volatility and Range
Bollinger Bands indicated moderate volatility, with price fluctuating near the midline for much of the day. A notable contraction in band width was observed during the 19:45–20:15 ET window, hinting at a possible breakout in the near future.
Volume and Turnover
Volume spiked sharply during the 18:15–18:30 and 21:45–22:00 ET windows, with notional turnover rising alongside price. The largest single-candle volume was recorded at 428,707.9 during the 21:45 ET window, confirming a strong move toward 0.1432. No significant divergence between price and volume was observed.
Fibonacci retracement levels based on the 0.1394–0.1432 swing showed 38.2% at ~0.1423 and 61.8% near 0.1412. Price hovered near the 38.2% level during the final hours, suggesting it could serve as a pivot for the next 24 hours.
In the near term, TRXXRP appears to be testing consolidation above 0.1420 with strong volume support, but overbought RSI and tight Bollinger Bands could signal an imminent correction or breakout. Investors should monitor 0.1430 as a key level—any close above could invite further bullish momentum, while a retest of 0.1420 may present a short-term buying opportunity. As always, sudden volume spikes or news events could disrupt this pattern.
Decodificar los patrones del mercado y desarrollar estrategias de trading rentables en el ámbito de las criptomonedas.
Latest Articles
Stay ahead of the market.
Get curated U.S. market news, insights and key dates delivered to your inbox.

AInvest
PRO
AInvest
PRO
Comments
No comments yet