
Market Overview for Tether/Rand (USDTZAR)


Summary
• Price action showed a bearish bias in early hours, later consolidating near key resistance.
• Volume increased significantly after 02:30 ET, confirming a potential short-term reversal.
• RSI remained neutral, suggesting lack of momentum in either direction.
• Bollinger Bands tightened in late hours, hinting at a possible breakout.
• A bullish engulfing pattern formed near support at 16.96, signaling potential for a rebound.
Market Overview
Tether/Rand (USDTZAR) opened at 17.00 on 2025-12-20 at 12:00 ET, reached a high of 17.02, a low of 16.94, and closed at 16.99 at 12:00 ET on 2025-12-21. Total volume traded over the 24-hour period was 153,622.0 ZAR, with a notional turnover of approximately ZAR 2.56M.
Structure & Formations
Price action revealed a bearish bias early in the session, with a pullback to 16.96 marking a key support area. A bullish engulfing pattern formed during the 02:30–03:00 ET window, suggesting potential reversal.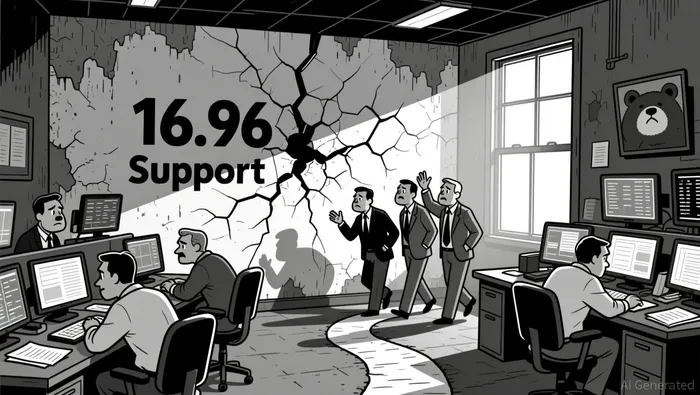 The price remained within a tight range later, indicating indecision.
Moving Averages
On the 5-minute chart, the 20-period and 50-period moving averages crossed during the early morning, forming a potential death cross. On the daily chart, the 50-period line appears to be testing the 100-period line, suggesting a possible short-term bearish tilt.
Momentum & Oscillators
MACD lines crossed near the zero line, with a bearish crossover hinting at weakening momentum. RSI remained in the 50–60 range for most of the day, indicating moderate bullish strength but no clear overbought conditions.
Volatility and Bollinger Bands
Bollinger Bands contracted sharply after 08:00 ET and remained narrow until early morning, signaling a period of consolidation. Price remained within the bands for most of the session, with no clear breakouts observed.
Volume and Turnover
Volume surged between 02:30 and 04:30 ET, coinciding with the formation of the bullish engulfing pattern. This suggests strong participation and could indicate a short-term reversal. Turnover increased alongside volume, confirming the price movement.
Fibonacci Retracements
Recent 5-minute swings showed the 38.2% and 61.8% Fibonacci levels at 16.98 and 16.96 respectively. Price briefly tested both levels, with 16.96 holding firm as a key support.
The market appears to be consolidating following the bearish morning push. A breakout above 17.02 could trigger a test of the next resistance at 17.05. Investors should be cautious of a potential retest of 16.96 and possible short-term volatility if volume spikes again.
Decoding market patterns and unlocking profitable trading strategies in the crypto space
Latest Articles
Stay ahead of the market.
Get curated U.S. market news, insights and key dates delivered to your inbox.


Comments
No comments yet