
Market Overview: Test/Tether (TSTUSDT) on 2026-01-03
Summary
• Price action shows a bearish reversal pattern near 0.01615, with key resistance at 0.01631 and support at 0.01601.
• Volume and turnover surged during the early morning dip but diverged with price, signaling potential volatility.
• RSI and MACD suggest weakening bullish momentum, with RSI hovering near mid-levels.
• Volatility expanded significantly during the sharp sell-off after 07:30 ET, with Bollinger Bands widening.
• Fibonacci retracement levels indicate potential for further consolidation near 0.01595 or a test of 0.01625.
Test/Tether (TSTUSDT) opened at 0.01601 on 2026-01-02 at 12:00 ET, reached a high of 0.01644, a low of 0.01573, and closed at 0.01597 on 2026-01-03 at 12:00 ET. The 24-hour volume was approximately 34,300,000 units, with a notional turnover of around $550,000.
Structure & Formations
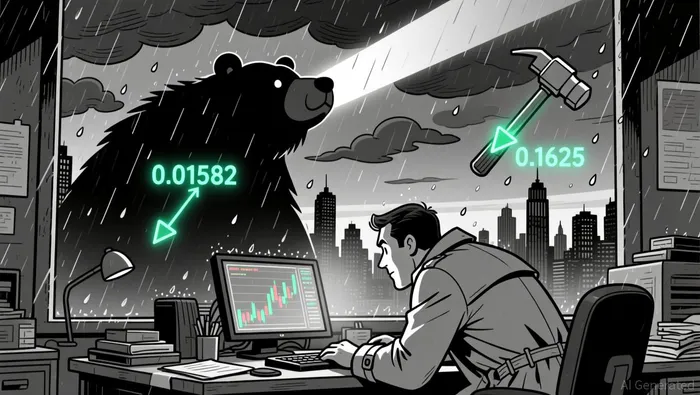
Price action featured a bearish reversal pattern as TSTUSDTTST-- fell below 0.01615, forming a key resistance level at 0.01631 and support at 0.01601. A large bearish candle at 07:30 ET confirmed the breakdown, with a high of 0.01603 and a close at 0.01582. A potential bullish hammer appeared near 0.01595, suggesting short-term buyers may re-enter the market.
Moving Averages and MACD
The 20-period and 50-period moving averages on the 5-minute chart crossed below key support levels during the drop, reinforcing bearish momentum. MACD turned negative after 07:30 ET, aligning with the price decline. The daily 50/100/200 EMA structure showed a flattening trend, with no clear directional bias.RSI and Volatility
Relative Strength Index (RSI) remained in mid-range territory, indicating neither overbought nor oversold conditions, but showing weakening bullish momentum. Volatility surged during the early morning selloff, with Bollinger Bands expanding significantly and price touching the lower band at 0.01582.
Volume and Turnover
Volume spiked during the early morning decline, with over 6.5 million units traded in the 07:30–07:45 ET period. Turnover also surged in that window but failed to confirm a strong bearish move, with a divergence between price and volume.
Fibonacci Retracements
Fibonacci levels based on the recent 5-minute swing from 0.01644 to 0.01573 indicate key support at 0.01595 (38.2%) and 0.01601 (50%), with a potential test of 0.01625 (61.8%) if buyers re-engage. Daily Fibonacci levels from the previous week also align with these key price areas.
Traders may see a test of 0.01601 in the next 24 hours as buyers attempt to defend the short-term support level. A breakdown below 0.01595 could trigger further downside to 0.01585. Investors should remain cautious of potential divergence in volume and price behavior, which may signal a false reversal or deeper correction.
Descifrar patrones de mercado y desarrollar estrategias de trading rentables en el ámbito de las criptomonedas.
Latest Articles
Stay ahead of the market.
Get curated U.S. market news, insights and key dates delivered to your inbox.


Comments
No comments yet