
Market Overview for Terra Classic/Tether (LUNCUSDT)
Summary
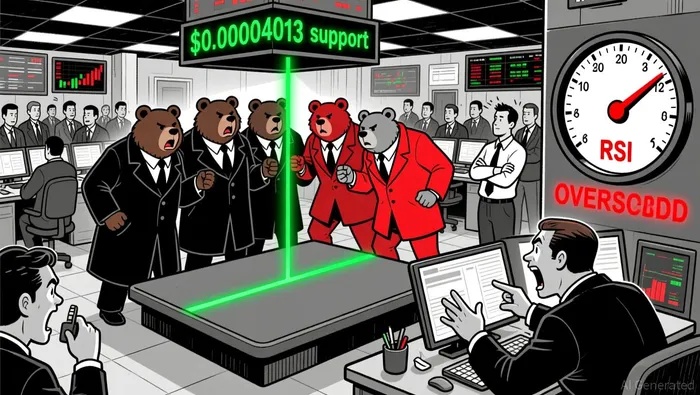
• Price drifted lower on high volume, testing critical support near $0.00004013.
• Bearish engulfing and doji patterns suggest waning bullish momentum.
• RSI moved into oversold territory, suggesting potential for a short-term bounce.
• Volatility increased as price expanded away from Bollinger Band midlines.
The pair opened at $0.00004074 on Dec 28 at 12:00 ET, peaked at $0.00004108, and closed at $0.00004014 on Dec 29 at 12:00 ET. Price hit a low of $0.00004012. Total volume was 11,838,267,857.51, with a turnover of $476,944.60.
Structure & Formations
Price action formed bearish engulfing and doji patterns during the downward leg, signaling potential exhaustion in the short-term rally. A critical support zone was observed near $0.00004013, which was briefly tested and held, suggesting possible consolidation ahead.
Moving Averages
On the 5-minute chart, the price closed below both 20 and 50-period moving averages, reinforcing a near-term bearish bias. Daily moving averages (50/100/200) remain higher than current price levels, indicating a longer-term divergence.
MACD & RSI
The MACD line crossed below the signal line, confirming a bearish crossover in the last 5-minute window. RSI fell into oversold territory at ~30, suggesting potential for a short-term bounce, though confirmation is needed.
Bollinger Bands
Volatility expanded through the night as price moved away from midlines and tested the lower band at key support levels. The widening bands suggest increased uncertainty, with a probable retest of the $0.00004013 level in the coming session.
Volume & Turnover
Volume surged during the price decline, particularly in the 18:00–22:00 ET window, confirming bearish momentum. Turnover aligned with price lows, showing no signs of divergence that might suggest a false break.
Fibonacci Retracements
The 61.8% Fibonacci retracement level of the most recent 5-minute swing was near $0.00004013, which price has now tested. A break below this level could open the path toward the next key support near $0.00004000.
Price may find near-term stability if $0.00004013 holds, but bearish momentum remains strong. Investors should watch for a rejection at this level or a breakdown for confirmation of further downside. Volatility and volume may remain elevated in the next 24 hours.
Decoding market patterns and unlocking profitable trading strategies in the crypto space
Latest Articles
Stay ahead of the market.
Get curated U.S. market news, insights and key dates delivered to your inbox.


Comments
No comments yet