
Market Overview: SushiSwap/Tether Enters Bearish Momentum on 24-Hour Downtrend
Summary
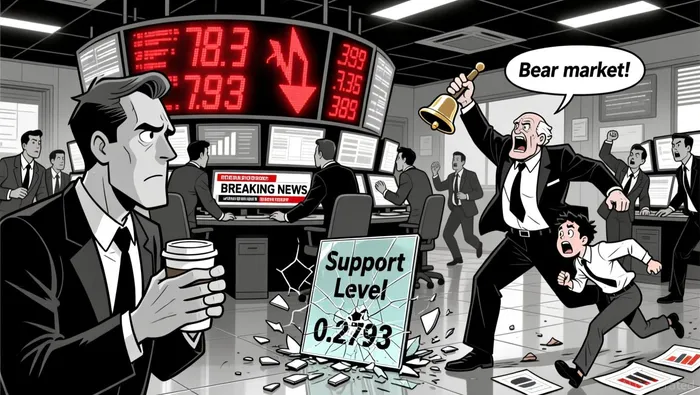
• Price declined to 0.2793, forming bearish engulfing and breakdown patterns.
• Volume surged to 606,346.5 with a divergence from price as it hit a 24-hour low.
• RSI and MACD signaled weakening momentum, while Bollinger Bands widened, reflecting increased volatility.
• Key support appears at 0.2786, with 0.2863 and 0.2921 as likely near-term resistance levels.
At 12:00 ET on 2025-12-31, SushiSwap/Tether (SUSHIUSDT) opened at 0.2953, reached a high of 0.2953, and closed at 0.2788, with a low of 0.2738. Total volume for the 24-hour window was 919,026.5, and turnover amounted to 243,977.8.
Price Action and Structure
The 5-minute candles showed a consistent bearish bias, with price breaking below key intraday support levels. A bearish engulfing pattern at 0.2854 and a breakdown candle at 0.2793 indicated aggressive selling. Price appears to be testing a multi-hour support at 0.2786, where a potential rebound or continuation could be expected.
Momentum and Oscillators
MACD and RSI both pointed to weakening bullish momentum. RSI entered oversold territory by the close, signaling potential for a near-term bounce. However, the lack of a strong reversal candle at 0.2786 raises the possibility of a further pullback.
Volatility and Bollinger Bands
Bollinger Bands expanded significantly during the afternoon session, reflecting heightened volatility. Price traded near the lower band in the final hours, consistent with a short-term overextension. A contraction in band width may precede a potential reversal, but the direction is uncertain.
Volume and Turnover
Volume spiked dramatically at 16:45 ET, with 606,346.5 units traded as price hit 0.2793. Notional turnover reached 168,298.65 as price moved lower. However, the price continued to decline despite the large volume, indicating a divergence that may suggest continued bearish pressure.
Fibonacci and Projections
Fibonacci retracement levels from the high of 0.2953 and low of 0.2738 show 38.2% at 0.2858, 61.8% at 0.2805. Price is currently near the 61.8% level, suggesting the 0.2786–0.2793 area as a potential floor for short-term consolidation.
The market may face renewed volatility over the next 24 hours as key support is tested. A close below 0.2786 could signal a deeper pullback, but a rejection here might trigger a rebound into 0.2839 or higher. Investors should remain cautious and monitor volume for confirmation of trend strength or exhaustion.
Decoding market patterns and unlocking profitable trading strategies in the crypto space
Latest Articles
Stay ahead of the market.
Get curated U.S. market news, insights and key dates delivered to your inbox.


AInvest
PRO
AInvest
PRO
Comments
No comments yet