
Market Overview for SuperRare/Tether (RAREUSDT)
Summary
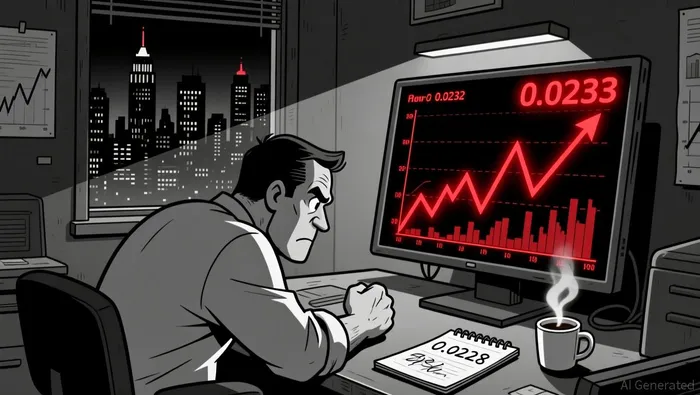
• Price action consolidates near 0.0233, with bearish pressure emerging after 21:00 ET.
• Volume spikes during key declines signal potential short-term exhaustion or bearish conviction.
• RSI remains neutral, but 61.8% Fibonacci support at 0.0230 is in focus.
• Bollinger Bands show narrowing volatility before a sharp price drop in early morning.
At 12:00 ET on 2026-01-11, SuperRare/Tether (RAREUSDT) opened at 0.0233, reached a high of 0.0235, and closed at 0.0233 after hitting a low of 0.0228. Total volume was 13,256,790.3, and notional turnover was $302,149.45.
Structure & Formations
Price action on the 5-minute chart showed a key bearish reversal pattern at the 0.0233 level, followed by a breakdown below 0.0232 in the late evening. The 0.0228 level acted as short-term support, creating a consolidation pattern with potential for further downside.
Moving Averages
On the 5-minute chart, price closed below the 20-period and 50-period moving averages, indicating a bearish bias. Daily moving averages (50, 100, 200) were not available for assessment.
Momentum and Relative Strength
The RSI stayed within neutral territory (40–55) throughout the day, suggesting a lack of overbought or oversold conditions. However, a sharp decline in the early morning pushed price near key Fibonacci support at 0.0230. The MACD showed negative divergence in the final hours, reinforcing bearish pressure.
Volatility and Bollinger Bands
Bollinger Bands displayed a tightening trend during the mid-day consolidation phase, followed by a breakout in the evening. Price dropped below the lower band at 0.0230, signaling potential short-term exhaustion or continuation of the bearish move.
Volume and Turnover
Volume spiked during the sharp decline from 0.0234 to 0.0228, with turnover peaking at over $50,000 in the 19:15–19:30 ET window. This suggests heightened bearish conviction. However, turnover dropped sharply below $5,000 after 0.0230 was tested, indicating potential short-term equilibrium.
Looking ahead, the immediate focus remains on the 0.0230 level for support and 0.0234 for resistance. A break below 0.0230 could open the door for further downward momentum, but limited volume during the recent pullback suggests caution for aggressive shorting.
Decodifica los patrones de mercado y desbloquea estrategias de comercio rentables en el espacio de criptomonedas
Latest Articles
Stay ahead of the market.
Get curated U.S. market news, insights and key dates delivered to your inbox.


Comments
No comments yet