
Market Overview for Storj/Tether (STORJUSDT): 24-Hour Price Action and Market Sentiment


Summary
• Price dropped sharply from 0.1156 to 0.1096 before recovering to 0.117 by the close.
• Key support held around 0.1104, with a strong rebound observed in the late hours.
• Volume surged on the downward move but remained mixed during the recovery phase.
• RSI and MACD indicate waning bearish momentum and potential for near-term consolidation.
• Volatility increased as the price moved outside of its 5-minute Bollinger Band range.
Storj/Tether (STORJUSDT) opened at 0.1156 on 2025-12-18 at 12:00 ET, dropped to a low of 0.1096, and closed at 0.1169 on 2025-12-19 at 12:00 ET, reaching a high of 0.1176. Total volume for the 24-hour period was approximately 1,278,250.0, with a notional turnover of ~144.0 (based on 77–93 trades per interval).
Structure & Formations
The candlestick pattern revealed a sharp bearish reversal in the early part of the day, with a strong bearish engulfing pattern at 0.1131–0.1157. Price later formed a bullish recovery, marked by a series of higher lows and consolidation above 0.1114. 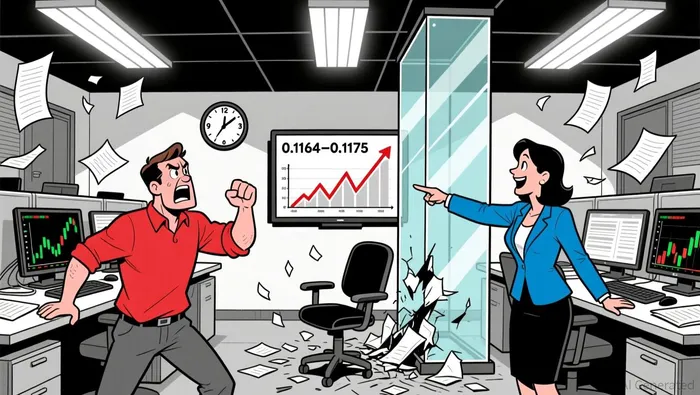 A long-bodied bullish candle formed just after 03:30 ET, signaling potential support at that level. A key resistance zone appears to be forming between 0.1164 and 0.1176.
Moving Averages and Fibonacci Retracements
A 20-period and 50-period moving average on the 5-minute chart show price has recovered above both, indicating a possible short-term bullish bias. Fibonacci retracement levels from the 0.1092 to 0.1176 swing show 0.1146 at 38.2% and 0.1164 at 61.8%, which appear to have acted as dynamic support/resistance during the day.
MACD and RSI
MACD showed a bearish crossover during the sharp drop to 0.1096 but began to show a bullish divergence in the latter half of the day. RSI bottomed near 30 in the early hours before climbing back to 52 by the close, suggesting a pullback in bearish momentum and a potential for further consolidation.
Bollinger Bands
Volatility expanded significantly during the early bearish move, with price moving well below the lower Bollinger Band. The band then retracted slightly as price stabilized. Currently, the price is trading near the upper band, signaling renewed bullish pressure and a possible short-term continuation.
Volume and Turnover
Volume spiked during the bearish leg, with a notable 202,317.0 traded at 0.1096–0.1104. Turnover was also higher during the decline but dropped off after 04:00 ET as price moved sideways. During the late rebound, volume remained steady but not exceptional, suggesting accumulation rather than aggressive buying.
Conclusion and Outlook
The sharp drop and subsequent rebound suggest a possible short-term equilibrium point forming around 0.1164–0.1176. A break above 0.1176 may trigger renewed bullish momentum, while a pullback below 0.1146 could signal another test of support. Investors should remain cautious as volume remains mixed and divergence in the indicators may point to a temporary lull in directional bias.
Descifrar patrones de mercado y desarrollar estrategias de negociación rentables en el ámbito de las criptomonedas.
Latest Articles
Stay ahead of the market.
Get curated U.S. market news, insights and key dates delivered to your inbox.

AInvest
PRO
AInvest
PRO
Comments
No comments yet