
Market Overview for Stargate Finance/Tether (STGUSDT)
Summary
• Price tested $0.1290–0.1295 key resistance, failed to hold, dropped to $0.1234 support.
• Volume surged during sharp sell-off late ET, confirming bearish momentum.
• RSI under 30 signals oversold conditions; trend reversal possible if buyers emerge.
• Bollinger Bands tightened before break, suggesting higher volatility expected.
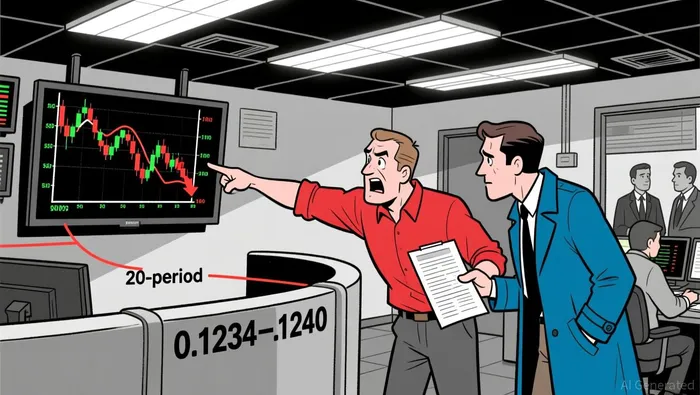
• 20-period MA dipped below 50-period, signaling short-term bearish bias.
Stargate Finance/Tether (STGUSDT) opened at $0.1283 on 2026-01-11 12:00 ET, reached a high of $0.1318, and fell to a low of $0.1234 before closing at $0.1256 on 2026-01-12 12:00 ET. Total traded volume was approximately 2,050,976.3 units, with notional turnover of $257,570.88 over the 24-hour period.
Structure & Formations
Price initially attempted to break above the $0.1290–0.1295 resistance range but failed to hold above key levels. A bearish engulfing pattern developed after a sharp decline into the evening, confirming a shift in sentiment. A potential support zone was tested at $0.1234–0.1240, which held briefly, forming a possible base for a short-term bounce.
Moving Averages
On the 5-minute chart, the 20-period MA fell below the 50-period MA, reinforcing bearish momentum. Daily MAs show the 50-period MA still above the 100- and 200-period MAs, suggesting the broader trend remains mixed but trending lower in the near-term.
MACD & RSI
The MACD turned negative late in the session as selling pressure increased, with the signal line crossing below. RSI dropped into oversold territory (under 30), hinting that a short-term pullback could occur if buyers step in. However, bearish divergence remains a concern for further downward drift.
Bollinger Bands
Volatility contracted during the early part of the session, followed by a sharp break to the downside that pushed prices to the lower Bollinger Band. Price has since remained near the band floor, signaling continued consolidation or potential for a rebound.
Volume & Turnover
Volume spiked sharply during the late ET sell-off, with over 250,000 units traded as prices fell toward $0.1234. Turnover confirmed the bearish move, aligning with price. However, recent volume has softened, suggesting potential exhaustion of the current move and a possible reversal.
Fibonacci Retracements
Recent 5-minute swings show a 61.8% Fibonacci level at $0.1260–0.1265 as a key psychological level for near-term buyers. On the daily chart, the 38.2% retrace lies at $0.1280, acting as an intermediate resistance ahead of the $0.1290–0.1295 key zone.
Looking ahead, a test of the $0.1245–0.1250 support is likely, with a potential rebound if buyers emerge. Traders should monitor for a reversal candlestick or bullish divergence on RSI as early signs of a recovery. However, given the current bearish bias and exhaustion in volume, a continuation of the downward trend remains a significant risk in the next 24 hours.
Decoding market patterns and unlocking profitable trading strategies in the crypto space
Latest Articles
Stay ahead of the market.
Get curated U.S. market news, insights and key dates delivered to your inbox.


Comments
No comments yet