
Market Overview for Space and Time/Tether


Summary
• SXTUSDT formed key support near $0.026 and failed to break above $0.0272.
• Volume surged during an early upward push, but declined afterward, suggesting exhaustion.
• RSI remains neutral, with no overbought/oversold signals.
• Price action shows a bearish engulfing pattern near $0.0272.
• Volatility expanded briefly during the 18:00–20:00 ET window.
The SXTUSDT pair opened at $0.0262 on 2025-12-16 at 12:00 ET, reached a high of $0.0276, and fell to a low of $0.0257 before closing at $0.0261 on 2025-12-17 at 12:00 ET. Total 24-hour volume was ~104,669,503.4, and turnover amounted to approximately $2,801,586.7 (assuming 1 unit × price).
Structure & Formations
Price action showed a bearish engulfing pattern at $0.0272, indicating rejection of higher levels. Support appears to hold near $0.026 and $0.0258, with a potential retest of these levels likely in the near term. A break below $0.0258 could lead to further downside.
Technical Indicators
The 20-period and 50-period moving averages on the 5-minute chart showed a flattening trend, suggesting short-term indecision. MACD remained in a neutral range with no clear signal.
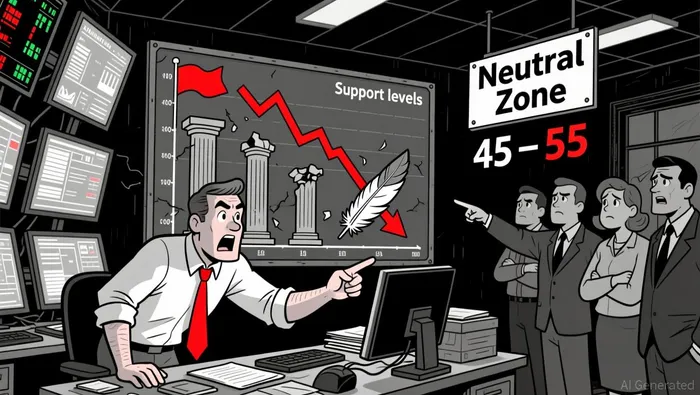 RSI hovered between 45 and 55, reinforcing the lack of strong momentum. Bollinger Bands expanded during the 18:00–20:00 ET surge, but price retracted into the lower half of the bands.
Volume and Turnover
Turnover spiked during the initial 18:00–19:30 ET rally, with a total of 11.4 million volume traded over two hours. However, volume tailed off in the following 2–3 hours, suggesting a lack of follow-through buying. Divergence between volume and price suggests the upside move may have run out of steam.
Fibonacci Retracements
From the $0.0258 to $0.0276 swing, the 61.8% retrace level is at $0.0265, where the pair briefly held but failed to consolidate. A retest of the 50% level at $0.0267 may determine near-term direction.
Looking ahead, the next 24 hours may see a continuation of consolidation or a test of key support at $0.0258. Investors should watch for a breakdown or a rejection on strong volume to confirm the next leg. As always, a sharp move either way carries potential risks from macro sentiment or order flow imbalances.
Decoding market patterns and unlocking profitable trading strategies in the crypto space
Latest Articles
Stay ahead of the market.
Get curated U.S. market news, insights and key dates delivered to your inbox.


Comments
No comments yet