
Market Overview: SPACE ID/Bitcoin on 2025-12-30
Summary
• Price action remained range-bound near 7.5e-07, with minor bearish breakdowns observed in the latter half.
• Volume spiked significantly at key price levels, confirming short-term resistance at 7.6e-07 and support at 7.3e-07.
• RSI hovered near neutral levels, with no clear overbought or oversold signals emerging.
SPACE ID/Bitcoin (IDBTC) opened at 7.6e-07 on 2025-12-29 at 17:00 ET, reached a high of 7.6e-07, dipped to a low of 7.3e-07, and closed at 7.3e-07 as of 12:00 ET on 2025-12-30. Total volume traded over 24 hours was 537,396.0 units, with a notional turnover of approximately 0.40347436 BTC.
Structure & Formations
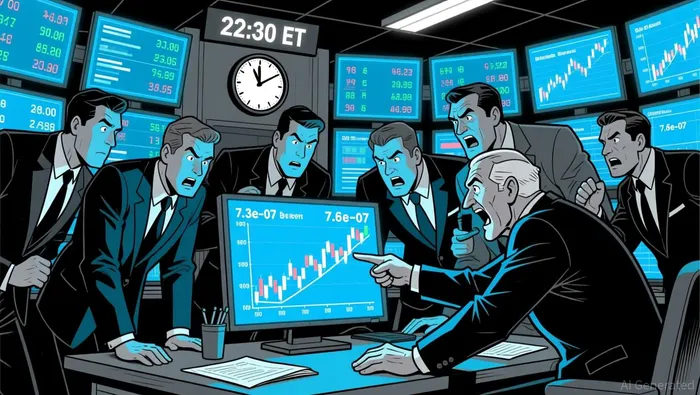
Price action on the 5-minute chart formed multiple narrow-range consolidation patterns, with key support identified around 7.3e-07 and resistance near 7.6e-07. A bearish breakdown occurred around 22:30 ET as the price dipped from 7.6e-07 to 7.5e-07 on increased volume, suggesting short-term bearish sentiment. A notable bearish engulfing pattern emerged at 22:30 ET, confirming the downward move.
Moving Averages
On the 5-minute chart, the 20-period and 50-period moving averages aligned closely near 7.5e-07, indicating a neutral bias. Price remained below these levels, suggesting a cautious outlook. Daily chart averages (50/100/200) were not directly visible in this timeframe but would need to be assessed to determine long-term direction.
Momentum and Volatility
MACD showed a neutral crossover, with no strong bearish or bullish momentum. RSI hovered between 45 and 55, indicating balanced buying and selling pressure. Volatility remained compressed within Bollinger Bands until the breakdown at 22:30 ET, after which price tested the lower band.
Volume and Turnover
Volume and turnover spiked at key price levels, particularly during the breakdown from 7.6e-07 to 7.5e-07, confirming the move. However, volume remained relatively low during consolidation periods, suggesting limited conviction in either direction.
Fibonacci Retracements
The 38.2% retracement level of the recent 5-minute upswing fell near 7.5e-07, which coincided with a minor support level. The 61.8% retracement near 7.4e-07 acted as a temporary floor.
The price may continue to test support at 7.3e-07 before finding a near-term bottom, though further breakdowns could trigger renewed bearish momentum. Investors should remain cautious of potential volatility and divergence between price and volume in the coming 24 hours.
Decoding market patterns and unlocking profitable trading strategies in the crypto space
Latest Articles
Stay ahead of the market.
Get curated U.S. market news, insights and key dates delivered to your inbox.


Comments
No comments yet