
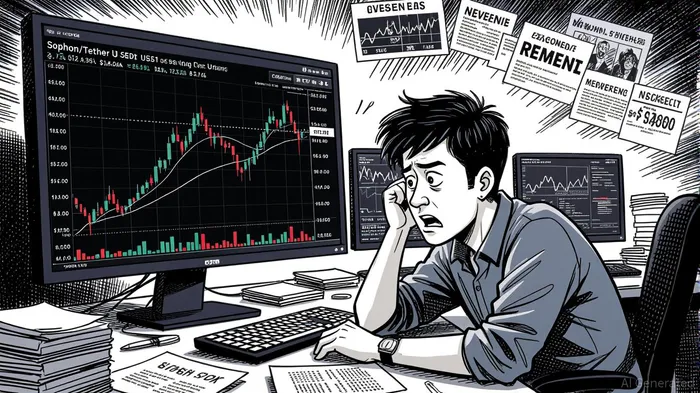
Market Overview for Sophon/Tether USDt (SOPHUSDT)
• Price action shows a bullish reversal from a key support level with a 0.618 Fibonacci retracement.
• Momentum remains mixed, with RSI near neutral territory and MACD indicating diverging bullish and bearish signals.
• Volatility expanded after 19:30 ET as SOPHUSDT broke above a recent resistance cluster.
• Turnover surged during the 21:30–22:00 ET timeframe, aligning with the breakout but with mixed follow-through.
• A bearish engulfing pattern appears at 02:15 ET, suggesting short-term caution despite overall upward drift.
Sophon/Tether USDt (SOPHUSDT) opened at 0.02927 on 2025-09-05 at 12:00 ET and closed at 0.02914 on 2025-09-06 at 12:00 ET. The 24-hour high reached 0.02959 while the low dipped to 0.02894. Total volume stood at ~19.1 million units, and notional turnover was approximately $560,000 over the period.
Price action during the 24-hour cycle shows a distinct bullish bias from a low of 0.02894 early on September 6. The pair tested a 0.618 Fibonacci retracement level (~0.02913–0.02915) twice and broke through on volume expansion. A bullish breakout from 0.0294–0.02945 resistance occurred after a consolidation period, followed by a minor pullback. This suggests short-term buying pressure is active but faces structural resistance near 0.0295–0.0296. The 15-minute chart shows a mixed but generally positive bias with an RSI hovering near 50, indicating moderate momentum but no clear overbought or oversold signals at close.
The 20-period and 50-period moving averages on the 15-minute chart are closely aligned, suggesting a flat to mildly bullish bias. The 50-period line sits above the 20-period, reinforcing the idea of a potential continuation to the upside if the 0.0295–0.0296 level is tested. MACD remains in a narrow range, with the histogram showing mixed signals—some positive divergence and minor bearish contractions. BollingerBINI-- Bands are expanding, indicating rising volatility in the last 4 hours of the period, particularly after 19:30 ET. Price has consistently traded near the upper band, reinforcing bullish momentum.
Volume and turnover were most notable between 21:30 and 23:45 ET, with several 15-minute candles showing high-volume surges. These occurred during the breakouts and pullbacks, indicating active participation from both bulls and bears. The volume-to-price relationship was relatively aligned during the 22:00–22:45 ET period, but the 23:45–00:15 ET candles showed a slight divergence in turnover compared to price, indicating possible fatigue after the initial rally. A bearish engulfing pattern formed at 02:15 ET, signaling short-term caution, though it was followed by a moderate bullish rebound.
The most notable Fibonacci retracement levels were identified from the swing low of 0.02894 and the swing high of 0.02959. The 0.618 level (~0.02914–0.02915) was a key support area tested twice and held, suggesting a strong psychological level for buyers. On a daily chart, the 50-period and 100-period moving averages are within 0.05% of each other, indicating a potential flattening of the medium-term trend. If the 0.0295–0.0296 level is tested again, it could serve as a potential Fibonacci extension target (~127.2%), especially if volume surges once more.
Backtest Hypothesis
A potential backtest strategy involves entering a long position when SOPHUSDT closes above a 15-minute 50-period moving average with a closing price above the upper Bollinger Band, and RSI above 55, while confirming a bullish divergence in the MACD histogram. A trailing stop loss is placed at the recent swing low, with a take-profit target aligned with the 0.0295–0.0296 resistance cluster and a Fibonacci extension of 127.2% (~0.02963–0.02965). This hypothesis would test whether the confluence of momentum, trend, and volatility indicators can generate consistent short-term gains in a range-bound to slightly bullish market. Given the observed price behavior, this setup may yield positive returns if executed in the next 24 hours, though risks remain in the form of consolidation or reversal at key psychological levels.
Descifrar los patrones del mercado y desarrollar estrategias de trading rentables en el ámbito de las criptomonedas.
Latest Articles
Stay ahead of the market.
Get curated U.S. market news, insights and key dates delivered to your inbox.


Comments
No comments yet