
Market Overview for Sei/Yen (SEIJPY)


Summary
• Price action shows a 24-hour decline from 18.01 to 17.38 with a late rally to 17.62.
• Key support levels appear at 17.38 and 17.50; resistance at 17.62 and 17.68.
• Volume spikes confirm breakdowns and bounces, but momentum in RSI suggests potential overbought and oversold extremes.
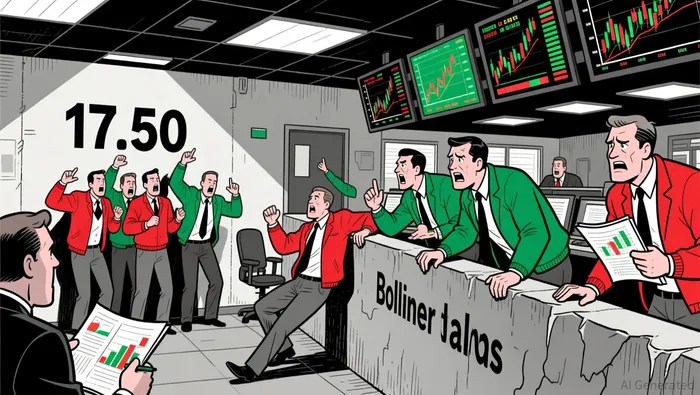
• Bollinger Bands reflect moderate volatility, with price often near or outside the lower band.
• Fibonacci retracements highlight 17.57 (61.8%) as a likely near-term turning point.
Sei/Yen (SEIJPY) opened at 17.92, reached a high of 18.01, and a low of 17.38, closing at 17.50 as of 12:00 ET. Total 24-hour volume was 98,881.0, with an estimated turnover of 1,693,446.3 Yen.
Structure & Formations
Price formed bearish engulfing patterns in early hours, followed by a bullish reversal after hitting 17.38. A key bullish engulfing pattern emerged near 17.38 at 08:30 ET, potentially signaling a short-term base.
Moving Averages
On the 5-minute chart, price consistently traded below 20- and 50-period moving averages, suggesting a short-term bearish bias. Daily averages (50/100/200) remain uncalculated due to insufficient data, but the trend remains neutral to bearish.
Momentum & Volatility
Relative Strength Index (RSI) dropped into oversold territory at 17.38 and recovered toward neutral levels at 17.50. Momentum appears to be stabilizing, but a break below 17.50 may trigger renewed selling. Bollinger Bands are wide, indicating moderate volatility.
Volume & Turnover
Volume was highly concentrated at key turning points: 17.38 (11,800), 17.62 (8,530), and 17.50 (9,880). Turnover confirmed price action at those levels, suggesting strong participation and potential for further consolidation or reversal.
Pattern & Fibonacci Levels
Key Fibonacci retracement levels from the 17.38 to 17.62 swing include 17.50 (61.8%), which acted as a strong support. A break below 17.50 may target 17.44 (38.2%), followed by 17.38 as the next major level.
The market appears to be consolidating after a sharp intraday decline, with potential for a rebound near 17.50. Traders should watch for a breakout above 17.62 for a possible rally or a breakdown below 17.50 for further bearish momentum. As always, be mindful of thin liquidity and high volatility in this pair.
Decoding market patterns and unlocking profitable trading strategies in the crypto space
Latest Articles
Stay ahead of the market.
Get curated U.S. market news, insights and key dates delivered to your inbox.


Comments
No comments yet