
Market Overview for Rune/Tether (RUNEUSDT)
Summary
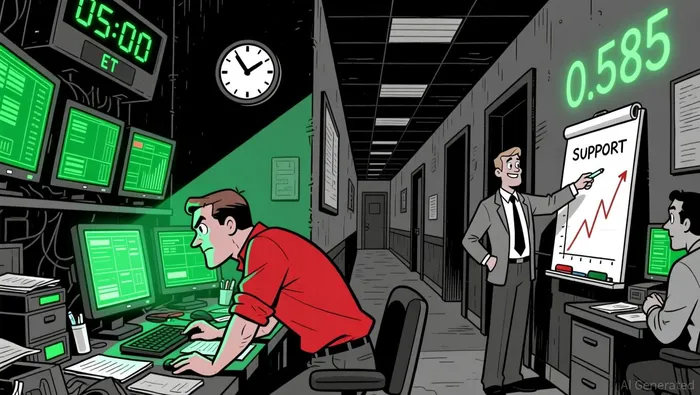
• Rune/Tether tested key support near $0.585 before rebounding, forming a bullish engulfing pattern at the end of the 24-hour period.
• Price volatility increased during the first half of the period, with Bollinger Bands showing a recent contraction.
• Volume remained elevated during the morning hours, peaking at 15:30 ET, but declined during the afternoon without clear directional confirmation.
• RSI crossed into oversold territory below 30 during the afternoon session, hinting at a potential short-term reversal.
Rune/Tether (RUNEUSDT) opened at $0.594 on 2026-01-06 12:00 ET, hit a high of $0.607, and a low of $0.580 before closing at $0.583 on 2026-01-07 12:00 ET. Total volume was 2,083,006.4, with $1,202,431.4 in notional turnover.
Structure & Key Levels
Price tested key support levels around $0.585 twice during the day, forming a bullish engulfing pattern at the 24-hour close. A potential short-term resistance is at $0.592, which acted as a psychological level during earlier parts of the session. A bearish breakdown below $0.580 could extend the downward move toward $0.575.
Momentum and Volatility
The 20-period and 50-period moving averages on the 5-minute chart showed a bearish crossover early in the session, but prices diverged later as RSI moved into oversold territory. Bollinger Bands contracted after 05:00 ET, suggesting a possible short-term breakout.
Volume and Turnover Divergence
Volume spiked during the early morning with a large candle at $0.607, but turnover failed to confirm the bullish move as the afternoon progressed. A divergence between price and turnover appeared around 14:15 ET when volume surged but price declined.
Key Fibonacci Levels
The most recent 5-minute swing from $0.607 to $0.580 showed 61.8% retracement at $0.594, which coincided with a key psychological level. Price currently sits near the 50% retracement level at $0.593, indicating potential for a short-term bounce or consolidation.
Market appears to be testing key support areas with potential for consolidation or a countertrend rally. A breakout above $0.594 may attract buyers, but sellers remain active near $0.585. Investors should remain cautious of thin volume and divergence in the afternoon session.
Decoding market patterns and unlocking profitable trading strategies in the crypto space
Latest Articles
Stay ahead of the market.
Get curated U.S. market news, insights and key dates delivered to your inbox.


Comments
No comments yet