
Market Overview for RedStone/Tether (REDUSDT)
Summary
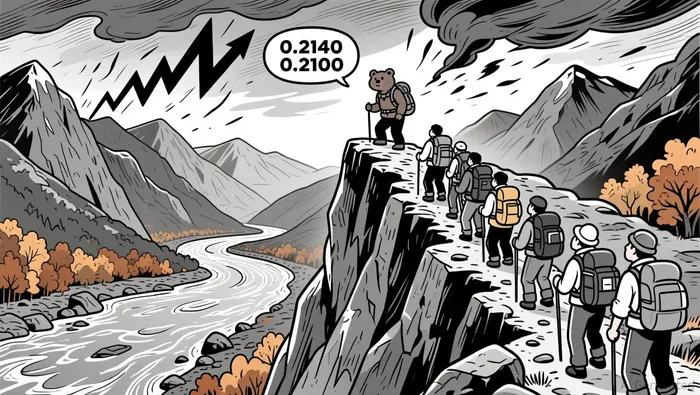
• Price tested key support at 0.2100 before rebounding, forming bullish engulfing patterns near 0.2120–0.2140.
• Volume spiked sharply after 0.2100 breakout, confirming renewed short-term momentum.
• RSI and MACD suggest moderate overbought conditions, hinting at potential near-term consolidation.
• Volatility expanded during 0.2100–0.2200 range, with Bollinger Band width reaching 14-day highs.
• Fibonacci levels at 0.2123 (38.2%) and 0.2143 (61.8%) appear to act as dynamic support/resistance.
RedStone/Tether (REDUSDT) opened at 0.2150 on 2025-12-31 12:00 ET, reached a high of 0.2201, a low of 0.2078, and closed at 0.2198 on 2026-01-01 12:00 ET. Total volume traded was 1,213,566.4 and turnover amounted to $256,279.63.
Structure & Formations
Price found strong support at 0.2100 before reversing and forming multiple bullish engulfing patterns between 0.2120–0.2140, suggesting short-term buyers gained control after a sharp breakdown attempt. A bearish doji formed at 0.2130 on early morning trading, hinting at indecision, but it was quickly absorbed by bullish follow-through.
Technical Indicators
The 5-minute RSI rose to 64 during the final 3 hours, indicating overbought conditions, while MACD showed positive divergence, suggesting momentum was trailing price. Daily Bollinger Bands expanded during the 0.2100–0.2200 move, confirming increased volatility.
Volume and Turnover Analysis
Volume surged at 0.2100–0.2115, confirming the rebound. A massive 956,758.6 volume candle on 01:00 ET helped push price from 0.2182 to 0.2198, but turnover only increased by 2.1%, suggesting mixed conviction. Divergence between price and turnover appeared in the final 45 minutes, signaling caution.
Fibonacci Retracements
Fibonacci levels from the 0.2078–0.2181 swing indicated key resistance at 0.2123 (38.2%) and 0.2143 (61.8%). Price stalled briefly at 0.2143 before continuing higher, suggesting it may retest these levels as dynamic support. The 0.2181–0.2201 high may serve as a near-term ceiling for the next 24 hours.
Market may consolidate around 0.2170–0.2190 in the near term after breaking key resistance. A retest of 0.2100 or a rejection at 0.2200 could signal the next directional move, but traders should remain cautious of potential overbought conditions.
Descifrar los patrones de mercado y desarrollar estrategias de trading rentables en el sector de las criptomonedas.
Latest Articles
Stay ahead of the market.
Get curated U.S. market news, insights and key dates delivered to your inbox.


Comments
No comments yet