
Market Overview for Raydium/Tether (RAYUSDT)
Summary
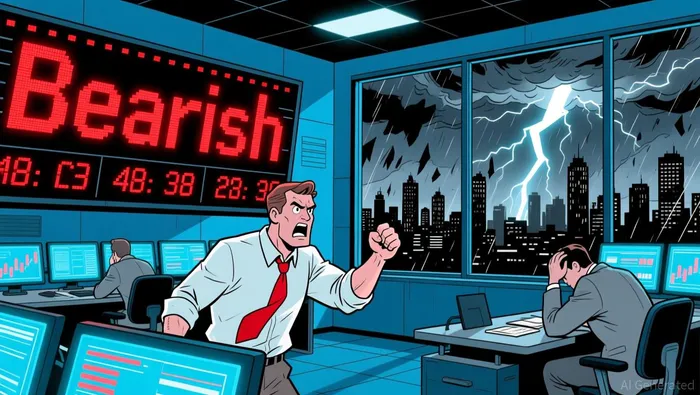
• Price formed a bearish engulfing pattern near $1.193 and declined into $1.165–$1.168 consolidation.
• Volume surged during the decline, confirming bearish momentum and a potential short-term support test.
• RSI dropped into oversold territory below 30, suggesting possible near-term stabilisation or a bounce.
Raydium/Tether (RAYUSDT) opened at $1.187 on 2026-01-09 12:00 ET, reached a high of $1.195, and fell to a low of $1.152 before closing at $1.180 on 2026-01-10 12:00 ET. Total 24-hour volume was 495,835.1 with a notional turnover of $570,875.66.
Structure & Formations
A bearish engulfing pattern formed near $1.193 during the early session, followed by a sharp decline into a $1.165–$1.168 range. Key support levels are forming around this area, with the 1.164 level showing initial resistance to further downside. A bullish reversal pattern may form if price stabilizes above $1.172 without breaking below $1.160.
Moving Averages and Momentum
The 20-period and 50-period moving averages on the 5-minute chart have moved lower, aligning with the downward trend. RSI has dropped into oversold territory below 30, suggesting a potential short-term bounce. MACD shows bearish divergence with a flattening histogram and a negative crossover, reinforcing the likelihood of continued consolidation or a pullback.
Volatility and Volume
Volatility increased as the price moved from $1.195 to $1.152, expanding Bollinger Band width. Price currently resides near the lower band, reinforcing the bearish bias. Volume spiked during the decline, confirming bearish momentum. However, volume has since tapered off, suggesting potential exhaustion.
Forward Outlook and Risk
Raydium/Tether appears to be stabilizing near key support, but without a clear breakout above $1.172 or below $1.160, the rangebound tone may persist. A breakout could trigger renewed volatility, while a sustained close below $1.164 may signal a more bearish phase. Investors should monitor volume for signs of conviction.
Decoding market patterns and unlocking profitable trading strategies in the crypto space
Latest Articles
Stay ahead of the market.
Get curated U.S. market news, insights and key dates delivered to your inbox.


Comments
No comments yet