
Market Overview: Radworks/Tether (RADUSDT) 24-Hour Summary
Summary
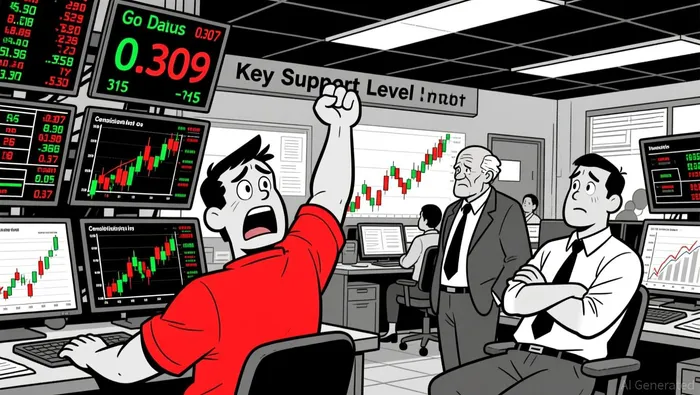
• Price consolidated between 0.308 and 0.315, with key support at 0.309.
• Strong volume spikes around 18:45–19:00 ET suggest potential short-term reversal.
• RSI indicates moderate momentum, without overbought or oversold extremes.
• Bollinger Band contraction implies a potential breakout scenario.
• Turnover and volume remained stable, showing no divergence from price.
RADUSDT opened at 0.314 on 2026-01-14 12:00 ET, reached a high of 0.315, a low of 0.307, and closed at 0.310 at 12:00 ET on 2026-01-15. Total 24-hour volume was 1,648,901.0 and turnover was 502,112.3 USDT.
Structure & Key Levels
Price action over the past 24 hours has been confined between 0.307 and 0.315. Notable support is forming around the 0.309 level, where multiple bullish reversal patterns, including bullish engulfing and doji, have emerged. Resistance remains at 0.313–0.314, where price has previously stalled.
Momentum and Volatility
RSI hovered between 45–55 for most of the session, indicating moderate momentum without signs of overbought or oversold conditions. Bollinger Bands have shown a slight contraction, suggesting a consolidation phase may precede a breakout. MACD remained flat with no strong directional bias.
Volume and Turnover
Volume spiked during the 18:45–19:00 ET timeframe as the price dipped to 0.308, followed by a recovery. Notional turnover matched volume patterns, with no significant divergence. Total turnover remained stable across the session, suggesting no major institutional involvement or panic selling.
Implications and Outlook
The 0.309 support level is critical for near-term bullish sentiment. A break below that could extend the downtrend toward 0.307. Conversely, a close above 0.314 may trigger a test of 0.315–0.316 as resistance. Investors should monitor volume and price behavior at key levels for confirmation.
Descifrar patrones de mercado y desarrollar estrategias de negociación rentables en el ámbito de las criptomonedas.
Latest Articles
Stay ahead of the market.
Get curated U.S. market news, insights and key dates delivered to your inbox.


Comments
No comments yet