
Market Overview: Pyth Network/Bitcoin (PYTHBTC) – December 19, 2025


Summary
• Pyth Network/Bitcoin traded in a narrow range with 6.4e-07 acting as strong support.
• Volume surged at 20:00 ET, confirming a pullback but failed to push past key resistance.
• RSI remains in neutral territory, suggesting neither overbought nor oversold conditions.
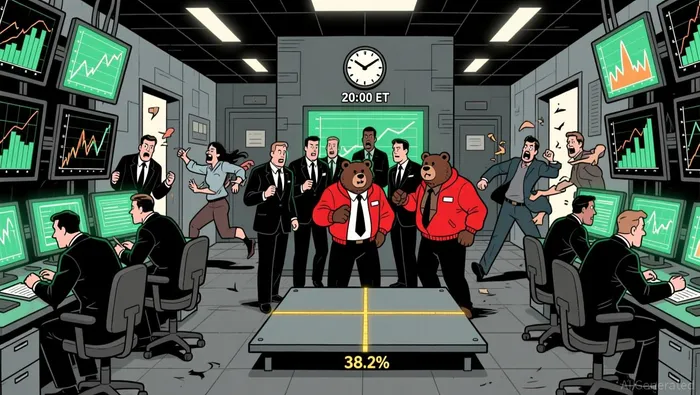
• Price is near 38.2% Fibonacci retracement level of a recent 5-minute bearish swing.
Pyth Network/Bitcoin (PYTHBTC) opened at 6.6e-07 on December 18 at 12:00 ET, reached a high of 6.6e-07, touched a low of 6.2e-07, and closed at 6.4e-07 on December 19 at 12:00 ET. Total volume was 216,782.2, and notional turnover stood at approximately 135.3.
Structure & Formations
The pair formed multiple consolidation patterns, with 6.4e-07 acting as a strong support level. A small bearish engulfing pattern was visible around 20:00 ET when volume spiked and the price fell from 6.5e-07 to 6.4e-07. No significant bullish patterns emerged, and the candlestick action remained largely sideways, suggesting indecision in the market.
MACD & RSI
The RSI hovered around 50 for most of the period, indicating a neutral to slightly bearish sentiment without extreme conditions. The MACD showed a weak bearish divergence during the pullback to 6.4e-07 but remained flat, suggesting that momentum has not clearly shifted.
Bollinger Bands
Volatility was relatively low, with the price largely staying near the middle band of the Bollinger Bands. No clear contractions or expansions were observed, and the narrow range suggests a lack of directional conviction.
Volume & Turnover
Volume picked up significantly between 20:00 and 21:00 ET when the price dropped from 6.5e-07 to 6.4e-07. However, the follow-through after 22:00 ET was weak, indicating that the bearish move may lack sustained follow-through. Turnover aligned with volume surges but did not confirm a strong directional bias.
Fibonacci Retracements
Price is currently near the 38.2% Fibonacci retracement level of the recent 5-minute bearish swing from 6.6e-07 to 6.2e-07. This level could act as either support or resistance depending on the next few hours of action. A break below 6.4e-07 would bring the 61.8% level into focus at 6.3e-07.
Over the next 24 hours, buyers may test the strength of the 6.4e-07 support level, while sellers could look for an opportunity to push the price back toward 6.2e-07. A breakout above 6.5e-07 may indicate renewed bullish momentum, but risks remain balanced for now.
Descifrar patrones de mercado y desarrollar estrategias de negociación rentables en el ámbito de las criptomonedas.
Latest Articles
Stay ahead of the market.
Get curated U.S. market news, insights and key dates delivered to your inbox.


Comments
No comments yet