
Market Overview for NEAR Protocol/Tether


Summary
• Price rallied to 1.716 before retracting to 1.601, suggesting a key resistance and possible support area.
• Volatility spiked during the day with volume peaking at 998k NEAR, but divergence suggests caution.
• RSI hit oversold territory briefly, hinting at potential short-term bounce but not strong momentum.
• Bollinger Bands widened as price broke lower, signaling increased bearish pressure.
• A bullish engulfing pattern formed near 1.640, which could mark a near-term turning point.
At 12:00 ET−1 on 2025-12-12, NEAR Protocol/Tether (NEARUSDT) opened at 1.647 and traded between 1.601 and 1.716 before closing at 1.601 at 12:00 ET. Total volume was 25,969,865.9 NEAR, with notional turnover of $41,601,338.
Structure & Formations
Price saw a significant break below the 1.640 psychological level, forming a bearish trend with a key swing low at 1.601. A bullish engulfing pattern emerged around 1.640, which could act as a potential reversal area if buyers return. Notable support appears near 1.601–1.610, with prior resistance at 1.640–1.676.
Moving Averages
On the 5-minute chart, the price closed below both the 20-period and 50-period moving averages, reinforcing bearish momentum. 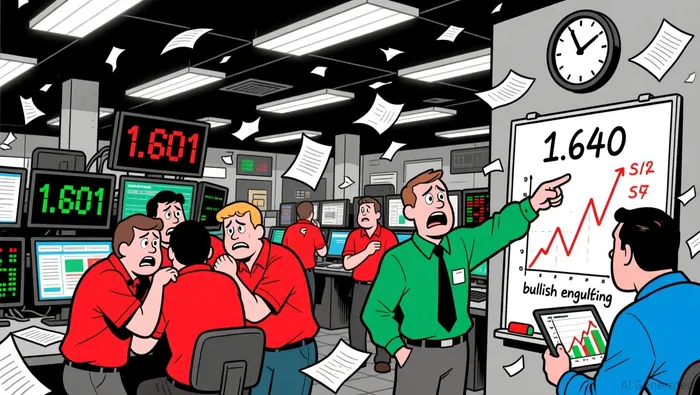 On the daily chart, the 50- and 100-period MAs are converging lower, indicating a possible continuation of the downtrend.
Momentum & Volatility
The RSI dipped below 30 during the session, suggesting short-term oversold conditions, though no strong rebound followed. MACD showed a bearish crossover in the morning, with negative momentum continuing into the afternoon. Bollinger Bands expanded as volatility increased, with price currently trading near the lower band, signaling bearish exhaustion or consolidation.
Volume & Turnover
Volume spiked dramatically during the afternoon, especially between 15:45–16:15 ET, as price collapsed to 1.601. However, the sharp drop occurred on a large volume spike, indicating capitulation rather than buying interest. Notional turnover confirmed the price drop, showing no divergence.
Fibonacci Retracements
Applying Fibonacci to the major 5-minute swing from 1.601 to 1.716, the 61.8% level at ~1.644 is a key area to watch for potential short-term bounce. On the daily chart, the 38.2% retracement level at ~1.664 may act as resistance should a recovery begin.
Market activity may see a pullback near 1.610–1.640 in the next 24 hours, but bearish pressure remains strong. Investors should remain cautious around key support levels and watch for volume confirmation or breakdowns.
Decoding market patterns and unlocking profitable trading strategies in the crypto space
Latest Articles
Stay ahead of the market.
Get curated U.S. market news, insights and key dates delivered to your inbox.


Comments
No comments yet