
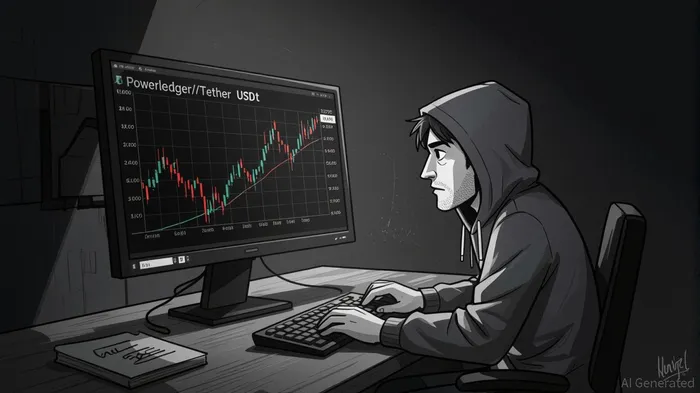
Market Overview: Powerledger/Tether USDt (POWRUSDT)
• Price action showed a sharp intraday rally, but closed near key support.
• Momentum indicators signaled overbought conditions during the peak rally.
• Volatility expanded mid-day, but volume flagged uneven participation.
• A bullish engulfing pattern formed on the 15-minute chart, but failed to hold.
• Fibonacci retracement levels provided temporary structure for price action.
Powerledger/Tether USDt (POWRUSDT) opened at $0.1565 on 2025-09-05 at 12:00 ET, reached a high of $0.1603, and closed at $0.1573 by 12:00 ET on 2025-09-06. The 24-hour trading volume totaled 612,153.5 and the notional turnover was $95,471.37. The session saw a strong rally into the early hours of 09-06, followed by consolidation and a pullback into support.
Structure & Formations
The 15-minute chart revealed multiple key turning points, including a bullish engulfing candle at $0.1592–0.1594 in early hours of 09-06, followed by a large bearish candle at $0.1594–0.1592, forming a potential topping pattern. A notable doji formed around $0.1593–0.1594, signaling indecision. The intraday swing from $0.1565 to $0.1603 marked a 2.3% move, with Fibonacci levels at 0.1589 (38.2%), 0.1595 (50%), and 0.1599 (61.8%) providing structure for price action. The close at $0.1573 aligned with the 38.2% retracement level, indicating potential support.
Moving Averages
Short-term momentum, as reflected by the 20- and 50-period moving averages on the 15-minute chart, showed a crossover into bullish territory during the rally but diverged from price action later in the session, suggesting weakening momentum. On the daily chart, the 50- and 100-period MA crossed into a bearish bias, while the 200-period MA remained as a long-term support. Price closed below both the 50 and 100-period lines, reinforcing the bearish tone.
MACD & RSI
The MACD crossed into positive territory during the rally but failed to maintain the signal, with a bearish divergence forming in the final hour. The RSI peaked above 70 during the intraday high, indicating overbought conditions, but quickly corrected below 50 by the end of the session, reflecting a reversal of momentum. The combination of MACD divergence and RSI retracement suggests a potential exhaustion of the short-term bullish move.
Bollinger Bands
Bollinger Bands widened significantly during the intraday rally, reflecting increased volatility. Price action reached the upper band before retreating toward the midline, confirming a temporary overbought condition. The narrowing of bands during the consolidation phase in late hours indicated a potential for a breakout or breakdown. The final close near the midline suggests a neutral stance for now, with a potential to test the lower band if the bearish trend continues.
Volume & Turnover
Trading volume spiked to 120,975 at $0.1592–0.1594 and again at 85,095 during the consolidation phase, but failed to confirm a breakout above $0.16. The largest turnover was observed during the 19:00–19:15 ET rally, which pushed price to $0.1603. However, volume during the bearish reversal was relatively weak, suggesting lack of conviction among sellers. The divergence between volume and price during the afternoon hours indicated uneven participation in the bearish move.
Fibonacci Retracements
Key Fibonacci levels from the $0.1565 to $0.1603 swing played a role in the intraday price action. The 38.2% retracement at $0.1589 and 50% at $0.1595 were tested multiple times, with the 61.8% at $0.1599 providing resistance. The 15-minute chart retracement levels (from $0.157 to $0.159) also showed influence, particularly at $0.1581 and $0.1585. The close at $0.1573 aligned with the 38.2% retracement level, reinforcing the short-term support.
Backtest Hypothesis
A potential backtesting strategy could involve a mean-reversion approach using the 20-period moving average and RSI. When the RSI falls below 30 (oversold) and the price closes below the 20 MA, a long signal could be triggered. Stop-loss would be placed below the previous swing low, and the target would be set at the 50% Fibonacci retracement level. Given the recent behavior of POWRUSDT, where price has tested the 38.2% retracement level multiple times, this strategy could help identify high-probability entry points in a volatile market environment. However, the divergence between volume and price during key turning points suggests the need for caution and further confirmation before entering.
Decoding market patterns and unlocking profitable trading strategies in the crypto space
Latest Articles
Stay ahead of the market.
Get curated U.S. market news, insights and key dates delivered to your inbox.


Comments
No comments yet