
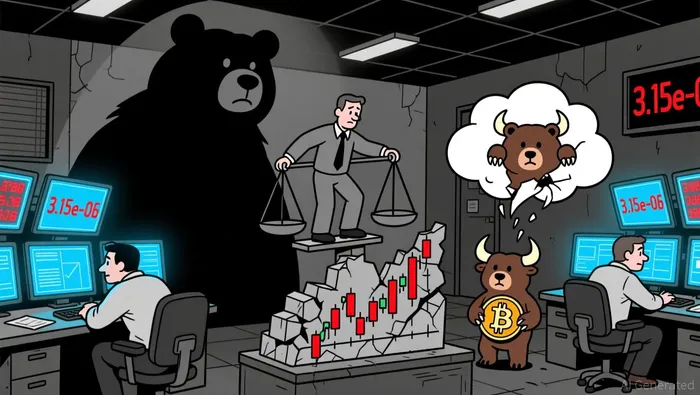
Market Overview: Phoenix/Bitcoin (PHBBTC) 24-Hour Summary
Summary
• Price drifted lower on low volume with key resistance at 3.15e-06 untested.
• A bearish engulfing pattern formed near 3.15e-06 early in the session.
• Volatility remained constrained, with price hovering near the lower Bollinger Band.
• Turnover surged at 11:00 and 11:30 ET, aligning with recent breakdowns.
• RSI and MACD suggest weakening momentum, but no oversold conditions yet.
Phoenix/Bitcoin (PHBBTC) opened at 3.15e-06 on January 8 at 12:00 ET, drifted to a high of 3.15e-06, and closed at 3.07e-06 on January 9 at 12:00 ET, hitting a low of 3.07e-06. Total volume was 689.4, with a notional turnover of 0.00225953 BTC.
Structure & Formations
Price action showed limited structure due to low volume, though a bearish engulfing pattern formed at 3.15e-06 after a short-lived rebound from 3.14e-06. A doji formed at 3.15e-06, indicating indecision. Key resistance appears at 3.15e-06, with support forming at 3.11e-06 and again at 3.07e-06.
Volatility and Bollinger Bands
Volatility remained compressed throughout the session, with price mostly near the lower Bollinger Band. A sharp sell-off at 11:00 and 11:30 ET caused price to break below 3.10e-06, ending near the lower band, suggesting potential for further short-term consolidation or a test of 3.07e-06.
Momentum Indicators
RSI declined from ~65 to ~40, indicating weakening bullish momentum but not yet oversold. MACD showed a bearish crossover and a negative histogram, aligning with the downward drift. A rebound may test the 3.11e-06 level for signs of reversal.
Volume and Turnover
Volume remained largely subdued, with notable spikes at 21:45 ET and 11:00–11:30 ET. These coincided with price breakdowns, offering confirmation of bearish bias. However, lack of sustained volume above 100 suggests limited conviction in any directional move.
Forward Outlook
With price consolidating near support at 3.07e-06, a bounce toward 3.11e-06 could be in play, but a break below 3.07e-06 may trigger further liquidation. Investors should monitor for volume confirmation or a bullish reversal pattern to signal a near-term bottom.
Decoding market patterns and unlocking profitable trading strategies in the crypto space
Latest Articles
Stay ahead of the market.
Get curated U.S. market news, insights and key dates delivered to your inbox.


Comments
No comments yet