
Market Overview: Phoenix/Bitcoin (PHBBTC) 24-Hour Summary


Summary
• PHBBTC formed a bullish engulfing pattern at 2.90e-06, suggesting potential reversal.
• Price traded within a 2.87e-06 to 2.94e-06 range, showing consolidation ahead of key levels.
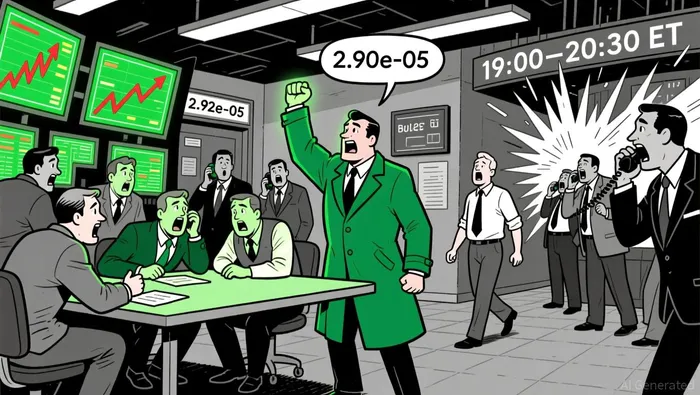
• Volatility expanded in the 19:00–20:30 ET window, with volume surging above 500 units during key swings.
Phoenix/Bitcoin (PHBBTC) opened at 2.87e-06 on 2025-12-19 at 12:00 ET and reached a high of 2.94e-06 before settling at 2.88e-06 by 12:00 ET the next day. Total volume for the 24-hour period was 12,189.2, with turnover averaging 2.91e-06.
Structure & Formations
Price action showed a consolidation pattern between 2.87e-06 (support) and 2.94e-06 (resistance), with a bullish engulfing pattern forming around 2.90e-06 during the 19:30–19:45 ET window. A doji at 2.92e-06 on 2025-12-19 indicated indecision.
Moving Averages
On the 5-minute chart, the 20-period MA hovered just below the 50-period MA, suggesting neutral momentum. Daily MAs (50, 100, 200) were not significantly crossed, keeping the trend neutral.
Momentum Indicators
MACD showed a minor bullish divergence during the 19:00–20:30 ET window, with RSI briefly dipping into oversold territory (28) before rebounding. The RSI peaked at 58, well below overbought levels.
Volatility & Volume
Bollinger Bands widened significantly during the 19:00–20:30 ET window, reflecting heightened volatility. Volume surged to 570.7 at 20:30 ET, coinciding with a downward price reversal. Notional turnover aligned with volume peaks during price swings.
Fibonacci Retracements
A key 61.8% retracement level was identified around 2.91e-06 from the swing high at 2.94e-06 to the low at 2.87e-06. Price reacted near this level, pausing for several 5-minute intervals.
Looking ahead, PHBBTC may test 2.91e-06 as a psychological pivot. A breakout above this level could trigger further bullish momentum, but risks remain balanced with bearish potential if volume fails to confirm a breakout. Investors should monitor key support at 2.87e-06 and potential retracement levels.
Descompresión de patrones del mercado y desbloqueo de estrategias de trading rentables en el espacio crypto
Latest Articles
Stay ahead of the market.
Get curated U.S. market news, insights and key dates delivered to your inbox.


Comments
No comments yet