
Market Overview for Phala Network/Tether (PHAUSDT)


Summary
• Price formed bearish engulfing patterns and tested support at $0.0358 throughout the session.
• Volatility expanded during a sharp decline, breaking below key moving averages.
• Notional turnover surged during the late ET sell-off, suggesting institutional or algorithmic participation.
• RSI moved into oversold territory after the decline, hinting at potential short-term bounce.
• Volume remained elevated during the downtrend but failed to confirm a strong reversal formation.
The 24-hour session for Phala Network/Tether (PHAUSDT) opened at $0.0359, reached a high of $0.0363, and fell to a low of $0.034, closing at $0.034 at 12:00 ET. Total volume was 2.78 million PHA, with $97,102 in notional turnover.
Structure & Formations
Price action displayed a series of bearish engulfing patterns, particularly during the 22:00 to 23:00 ET window, confirming bearish momentum. A key support level at $0.0358 was tested multiple times, but failed to hold as price drifted lower. 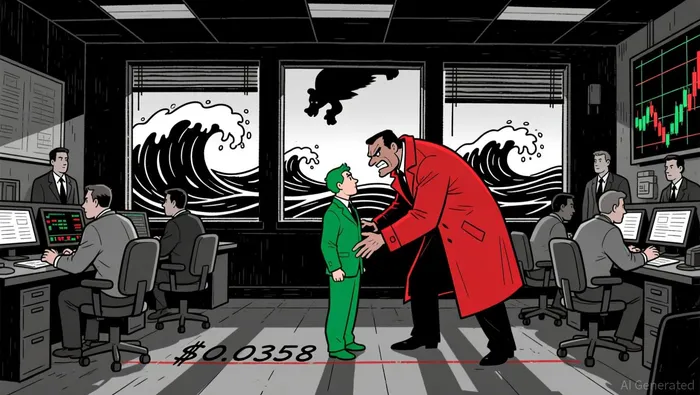 A late ET rejection at $0.0341 suggested a possible short-term bounce but failed to trigger a strong reversal.
Moving Averages
The 20-period and 50-period 5-minute moving averages crossed lower in the late ET session, reinforcing the bearish bias. A period of consolidation was observed in the 04:00–07:00 ET range before volatility flared again.
MACD & RSI
MACD lines turned negative after 21:00 ET and showed bearish divergence as price approached $0.035. RSI dropped into oversold territory by 13:00 ET, hinting at a potential short-term rebound.
Bollinger Bands
Volatility expanded significantly during the 20:00 to 23:00 ET window as the price broke below the lower band. Daily MAs (50/100/200) were not clearly defined over the 24-hour window due to the short span, but price was clearly below the 20-period MA for much of the session, indicating short-term bearish control.
Volume & Turnover
Volume spiked sharply during the late ET sell-off, with a notable block at $0.0343 (208,368 PHA) suggesting large sell orders. Turnover remained elevated during the decline but waned during the consolidation phase, indicating a lack of follow-through from buyers.
Fibonacci Retracements
A 5-minute swing from $0.0361 to $0.034 showed a 61.8% retracement at $0.0349, where price briefly found support before continuing the downtrend. On the daily chart, retracement levels were not clearly defined over the 24-hour window.
The market appears to be consolidating in the immediate range of $0.034–$0.035. A test of the $0.035 level could trigger a bounce, but a break below $0.034 could lead to further short-term weakness. Investors should remain cautious as volatility remains elevated and momentum indicators suggest no clear direction at this time.
Decoding market patterns and unlocking profitable trading strategies in the crypto space
Latest Articles
Stay ahead of the market.
Get curated U.S. market news, insights and key dates delivered to your inbox.


Comments
No comments yet