
Market Overview for Pepe/Tether (PEPEUSDT)


Summary
• Price action shows a bullish consolidation after a sharp decline, with key support at $4.43 and resistance near $4.47.
• Momentum indicators suggest weakening bearish pressure, but RSI remains in neutral territory.
• Volatility has contracted following a sharp selloff, with volume showing moderate signs of stabilizing.
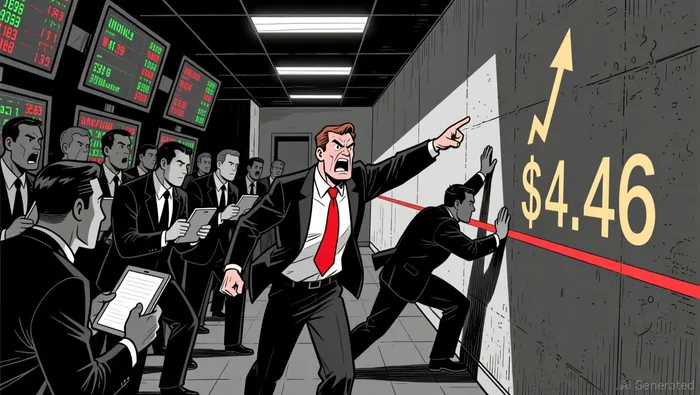
At 12:00 ET on 2025-12-11, Pepe/Tether (PEPEUSDT) opened at $4.73, traded between $4.38 and $4.93, and closed at $4.46. Total volume was 14.44 trillion, with $64.8 million in notional turnover.
Structure & Formations
Price action has formed a bearish wedge pattern on the 5-minute chart, with a descending trendline and flat lower bound converging. A breakdown below $4.43 may signal further downside, though a bullish engulfing pattern near that level could indicate support. A key resistance appears to be forming at $4.47, where price previously stalled multiple times.
Moving Averages
Short-term momentum on the 5-minute chart has diverged from longer-term trends. The 20-period MA is below the 50-period MA, suggesting bearish momentum, but price has tested and bounced from the 50 MA on several occasions, indicating potential near-term buying interest.
MACD & RSI
The MACD has moved into positive territory after a sharp bearish crossover earlier in the day, signaling possible short-term recovery. RSI remains within neutral territory (around 50), suggesting neither overbought nor oversold conditions. A breakout above 55 could signal renewed bullish momentum.
Bollinger Bands
Volatility has recently tightened after a period of expansion, with price hovering near the lower band of the Bollinger Band. This contraction may precede a breakout or breakdown, and a closing below the lower band could reinforce bearish sentiment.
Volume & Turnover
Volume has moderated after a sharp spike during the selloff, suggesting a possible exhaustion of bearish pressure. However, the volume during the consolidation phase remains elevated compared to earlier in the week, indicating ongoing interest from both buyers and sellers.
Fibonacci Retracements
On the 5-minute chart, the most recent swing high at $4.93 and low at $4.38 align with key Fibonacci levels. Price currently sits near the 61.8% retracement at $4.46, a critical level that may determine the next move—either a resumption of the bear trend or a reversal back to the previous high.
Over the next 24 hours, Pepe/Tether could test the 61.8% Fibonacci level for a potential bounce or breakdown. Investors should remain cautious about a potential continuation of the bear trend, particularly if volume confirms a breakdown below $4.43.
Decoding market patterns and unlocking profitable trading strategies in the crypto space
Latest Articles
Stay ahead of the market.
Get curated U.S. market news, insights and key dates delivered to your inbox.


Comments
No comments yet