
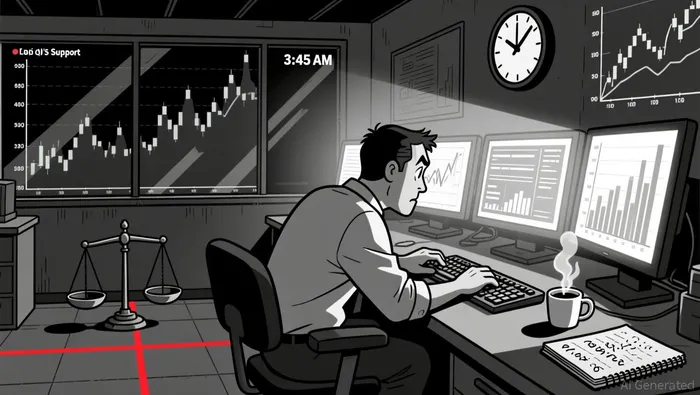
Market Overview for Orchid/Bitcoin (OXTBTC) on 2026-01-08
Summary
• Price action remained range-bound with minimal movement in the OXTBTC pair.
• Volatility remained low with several hours of zero trading volume recorded.
• A potential bearish signal emerged during the 3:45 AM ET candle with a 3.6% drop in price.
• The 24-hour turnover was extremely low, indicating weak investor interest.
• No clear RSI divergence or overbought/oversold signals were observed.
The Orchid/Bitcoin (OXTBTC) pair opened at 2.8e-07 on 2026-01-07 12:00 ET, reached a high of 2.8e-07, a low of 2.7e-07, and closed at 2.8e-07 on 2026-01-08 12:00 ET. Total volume was 175,853.0, and turnover was 0.05049522 over 24 hours.
Structure & Formations
The OXTBTC pair traded within a narrow range, with a key support level forming at 2.7e-07 following the 3:45 AM ET candle’s downward move. No strong resistance above 2.8e-07 was tested, with most candles closing unchanged. A doji-like pattern developed at the 3:45 AM ET candle, suggesting indecision.
Moving Averages
On the 5-minute chart, the price remained flat above the 20- and 50-period moving averages, indicating no clear trend. Daily moving averages (50, 100, 200) appear irrelevant due to the flat structure and limited price movement.
MACD & RSI
MACD remained near zero with no clear trend, suggesting neutral momentum. The RSI hovered around the mid-50 level, showing no overbought or oversold conditions.
Bollinger Bands
The Bollinger Bands narrowed significantly throughout the 24 hours, indicating low volatility. Price action remained tightly compressed within the bands for most of the session, with a brief deviation at 3:45 AM ET.
Volume & Turnover
Trading activity was sparse, with over half the 5-minute candles recording zero volume. Notable spikes occurred around 9:15 PM, 11:15 PM, and 3:45 AM ET, but they failed to produce significant price movement. Turnover remained consistent with volume, showing no divergences.
Fibonacci Retracements
On the 5-minute chart, the price briefly dipped to the 38.2% Fibonacci level at 2.7e-07 but quickly rebounded, failing to confirm a strong bearish signal.
Looking ahead, the next 24 hours may see a test of the 2.7e-07 support or a consolidation above 2.8e-07. Investors should remain cautious as low volume may suggest a lack of conviction and could lead to choppy, directionless price movement.
Decoding market patterns and unlocking profitable trading strategies in the crypto space
Latest Articles
Stay ahead of the market.
Get curated U.S. market news, insights and key dates delivered to your inbox.

AInvest
PRO
AInvest
PRO
Comments
No comments yet