
Market Overview: Optimism/Tether (OPUSDT) 24-Hour Analysis
Summary
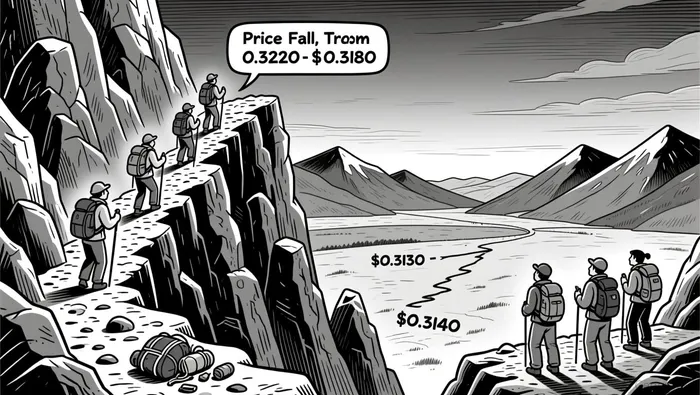
• Price fell sharply overnight, forming bearish engulfing patterns below $0.3170.
• RSI and MACD both signal bearish momentum with oversold conditions emerging.
• Volatility expanded through Bollinger Bands, while volume spiked during the selloff.
• A potential support zone is forming near $0.3130–$0.3140, with no clear reversal yet.
Optimism/Tether (OPUSDT) opened at $0.3241 on 2026-01-04 12:00 ET, reaching a high of $0.3252 and a low of $0.3125 before closing at $0.3150 on 2026-01-05 12:00 ET. Total 24-hour volume was 7.68 million OP, and turnover was $2.34 million.
Structure & Key Levels
Price action formed a clear bearish bias overnight, with several bearish engulfing patterns observed between $0.3220 and $0.3180. A potential support zone has emerged between $0.3130–$0.3140, marked by clustered lows and a failed rally attempt. No immediate bearish reversal patterns have appeared, suggesting caution for short-term buyers. Resistance near $0.3195 and $0.3205 appears key for near-term retests.
Technical Indicators
The MACD line has crossed below the signal line, signaling bearish momentum, while the RSI has dipped toward oversold territory at ~29, suggesting limited near-term downside unless the move accelerates. On the Bollinger Bands, price has widened significantly, with the 5-minute chart showing the price trading near the lower band, reinforcing the bearish pressure.
Volume and Turnover
Volume surged during the overnight decline, especially around $0.3155–$0.3160, confirming the bearish move. Turnover also spiked during this period, aligning with price action and reinforcing the likelihood of a sustained test toward the $0.3130–$0.3140 zone. No notable divergence appears between price and volume, suggesting the trend may continue unless a large counter-trend bar forms.
Implications and Outlook
Price action suggests a possible short-term pullback toward $0.3130–$0.3140 is in play, with a potential for a bullish bounce if the support holds. However, a break below this zone could accelerate the decline toward $0.3120. Caution is warranted if the RSI fails to rebound and volume remains weak in a rally attempt. Investors should watch for a bullish reversal pattern or a retest of the $0.3175–$0.3180 area with strong volume for signs of stability.
In the next 24 hours, a retest of key support levels is likely, but a break below $0.3140 could trigger renewed bearish momentum. As always, market conditions can change rapidly, especially in the volatile crypto space.
Decoding market patterns and unlocking profitable trading strategies in the crypto space
Latest Articles
Stay ahead of the market.
Get curated U.S. market news, insights and key dates delivered to your inbox.


Comments
No comments yet