
Market Overview: OGNUSDT (Origin Protocol/Tether) – 24-Hour Technical Summary
Summary
• Price rallied to 0.0326 before consolidating near 0.0318–0.0321.
• Strong volume spikes confirmed bullish 5-minute breaks in early morning ET.
• RSI shows signs of overbought pressure, suggesting short-term pullback risk.
• Bollinger Bands expanded during late-day volatility, reflecting rising uncertainty.
• Key support at 0.0309–0.0311 held multiple times; resistance now at 0.0322.
Origin Protocol/Tether (OGNUSDT) opened at 0.0311, reached a high of 0.0326, and a low of 0.0307, closing at 0.0318. Total volume was 7,673,185.0, with a notional turnover of 238.68.
Structure & Price Action
Price action revealed a bullish breakout above 0.0321 during the 11:45–12:00 ET window, confirmed by volume. The 0.0318–0.0321 range appears to be consolidating as a new equilibrium. On the downside, the 0.0309–0.0311 zone has functioned as a recurring support, showing resilience despite bearish attempts.
Trend and Moving Averages
On the 5-minute chart, price held above both 20- and 50-period moving averages in the final hours, suggesting short-term strength. While the daily chart shows no clear EMA alignment due to limited data, the 5-minute momentum suggests a possible continuation of the current bullish trend.
Momentum and Volatility
The RSI rose into overbought territory (above 65) during the morning ET rally, indicating possible profit-taking. 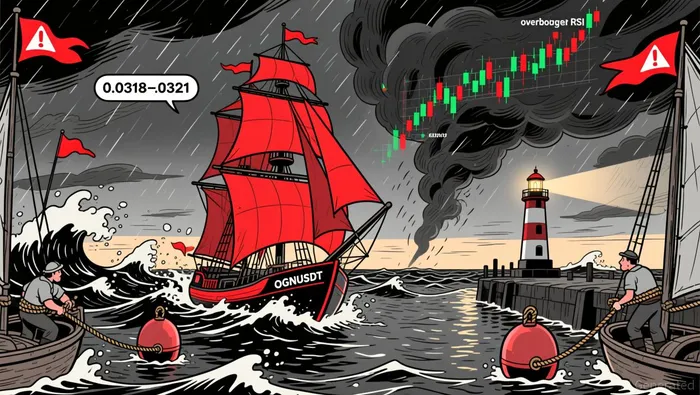 MACD showed a positive divergence during the 0.0318–0.0321 consolidation, reinforcing bullish sentiment. Bollinger Bands expanded significantly during the late-day volatility, highlighting increased uncertainty in price direction.
Volume and Turnover Analysis
The largest volume spike occurred at 15:15 ET (919,008.0) when price fell from 0.0322 to 0.0319, suggesting aggressive selling. This was followed by a sharp rally at 14:30 ET, with over 624,787.0 volume, confirming a short-covering move. Price and volume aligned on these key swings, indicating strong conviction in both bearish and bullish phases.
Fibonacci Retracements
On the 5-minute chart, the 0.0322 level (61.8% retracement of the 0.0309–0.0326 move) acted as a temporary ceiling. On the daily scale, the 0.0309 level (38.2% retracement of a larger prior bear leg) remains critical. A break below this could signal a larger retest of lower levels, though resistance above 0.0321 may delay that scenario.
The market may consolidate near 0.0318–0.0321 in the near term, but watch for a break above 0.0323 as a potential catalyst for further gains. Traders should be cautious of overbought RSI levels and divergent price-volume behavior below 0.0315 in the next 24 hours.
Decoding market patterns and unlocking profitable trading strategies in the crypto space
Latest Articles
Stay ahead of the market.
Get curated U.S. market news, insights and key dates delivered to your inbox.


Comments
No comments yet