
Market Overview: Neo/Tether (NEOUSDT) on 2026-01-09
Summary
• Price declined from $3.954 to $3.991 with bearish 5-minute engulfing patterns midday.
• Volume surged to 18,260.66 during a late afternoon breakout attempt.
• RSI reached overbought levels after a sharp rally, indicating potential consolidation.
• Bollinger Bands expanded in the final hours, suggesting rising short-term volatility.
• Fibonacci retracements aligned with key 5-minute lows at $3.93 and $3.915 as potential support.
Neo/Tether (NEOUSDT) opened at $3.915 on 2026-01-08, peaked at $4.028, and closed at $3.991 on 2026-01-09 at 12:00 ET. The pair traded between $3.874 and $4.018 over the 24-hour window. Total volume reached 182,606.6, with a notional turnover of $72,630,319.81.
Structure and Candlestick Formations
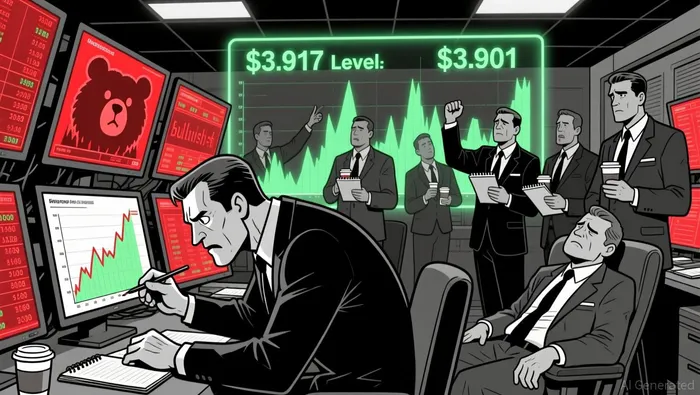
Price carved a distinct bearish 5-minute engulfing pattern at $3.94–$3.936 and a bullish one at $3.944–$3.95. Key support levels emerged at $3.917 and $3.901, both coinciding with prior lows and Fibonacci retracement levels. A late afternoon rally above $3.995 appeared to test resistance from the upper Bollinger Band, with no decisive break beyond.
Moving Averages and Momentum
 The 5-minute 20-period and 50-period moving averages trended lower for most of the session, but a sharp upward shift occurred during the final hours. RSI moved into overbought territory above 70 for a short period, signaling potential overextension. MACD showed a bullish crossover in the final 90 minutes but failed to maintain positive momentum.
 Volatility and Volume
Volatility remained moderate until 16:45 ET, when Bollinger Bands expanded as price surged above $3.995. Volume spiked sharply during this period, reaching a session high of 18,260.66. Turnover closely followed the same trend, confirming price action. However, volume failed to sustain the breakout, suggesting potential exhaustion.
Fibonacci Retracements and Implications
Fibonacci retracements from the $3.874 to $4.028 swing highlighted key levels at 61.8% ($3.942) and 38.2% ($3.964). Price found support at $3.917 (61.8% of the earlier 5-minute swing) and appeared to struggle to confirm a new higher low.
Looking ahead, traders may watch for a retest of the $3.917 level as well as confirmation above $3.995 to signal a potential trend continuation. However, the recent volume divergence and overbought RSI suggest caution for near-term bullish bets.
Decoding market patterns and unlocking profitable trading strategies in the crypto space
Latest Articles
Stay ahead of the market.
Get curated U.S. market news, insights and key dates delivered to your inbox.

AInvest
PRO
AInvest
PRO
Comments
No comments yet