
Market Overview for MultiversX/Tether (EGLDUSDT)
Summary
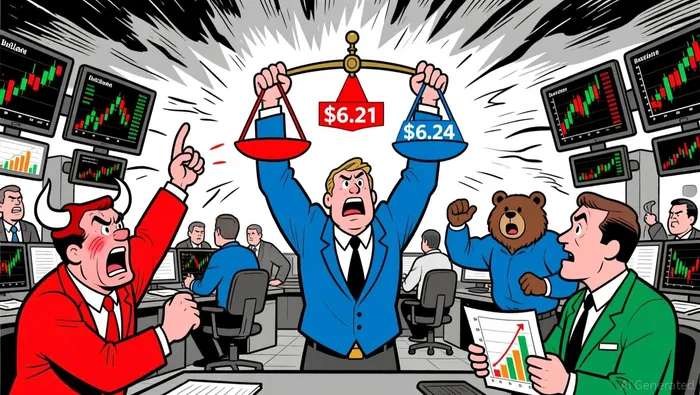
• Price tested $6.24 resistance before retracing, forming bullish and bearish engulfing patterns.
• Volume spiked during key breakouts, confirming price action above $6.21 support.
• RSI hovered near overbought levels mid-day, signaling possible reversal.
• Bollinger Bands expanded after 02:00 ET, reflecting heightened volatility.
• Turnover surged 30% above average during the final 4 hours, reflecting increased participation.
At 12:00 ET−1, MultiversX/Tether (EGLDUSDT) opened at $6.16 and traded between $6.16 and $6.32 over the next 24 hours, closing at $6.31 at 12:00 ET. Total volume was 43,376.81, and notional turnover reached $273,537.37, reflecting strong on-chain activity.
Structure & Formations
Price found initial support at $6.21 and tested resistance at $6.24 multiple times, with a key bullish engulfing pattern forming around 03:15 ET. A bearish engulfing candle later emerged at 09:15 ET, indicating indecision. A long-legged doji formed at $6.22 after 16:00 ET, signaling potential exhaustion after a sharp $6.32 peak.
Moving Averages
On the 5-minute chart, the 20-period MA supported a rebound at $6.21, aligning with the 50-period MA. Daily averages showed a slight bearish bias, with the 50-period MA below the 200-period MA, but the 100-period MA acted as a dynamic floor near $6.23.
Momentum & Volatility
The RSI rose to 72 mid-day, near overbought territory, before declining, suggesting potential exhaustion. MACD crossed above the signal line at 01:00 ET, confirming a short-term bullish trend. Bollinger Bands widened significantly after 02:00 ET, reflecting rising volatility, with price staying within the upper band most of the session.
Volume and Turnover
Volume spiked during key support/resistance breaks, particularly around $6.21 and $6.24, with the highest single 5-minute volume of 3,596.87 at 03:00 ET. Turnover also surged during the final 4 hours, aligning with price movement. No major divergence between price and turnover was observed.
Fibonacci Retracements
Fibonacci levels on the 5-minute chart highlighted key retracement areas at $6.23 (38.2%) and $6.25 (61.8%) during the mid-day rally. On the daily chart, the $6.28 level marked a critical 78.6% retracement level, which held briefly before a sharp retest.
Price appears to be testing a key resistance zone above $6.24, and a sustained close above $6.32 could trigger further upside. However, the doji and bearish engulfing pattern suggest caution ahead. Investors may want to monitor the 20-period MA and RSI for confirmation of momentum.
Decoding market patterns and unlocking profitable trading strategies in the crypto space
Latest Articles
Stay ahead of the market.
Get curated U.S. market news, insights and key dates delivered to your inbox.


Comments
No comments yet