
Market Overview for MultiversX/Tether (EGLDUSDT) – 24-Hour Analysis
Summary
• Price declined from 5.89 to 5.71, forming bearish engulfing and bear trap patterns.
• RSI and MACD show bearish momentum with RSI near oversold territory.
• Volatility expanded, with price breaking below key support levels and testing 5.65.
• Bollinger Bands show wide expansion, with price near the lower band.
• Volume spiked during key breakdowns, confirming bearish bias.
MultiversX/Tether (EGLDUSDT) opened at 5.89, peaked at 5.93, and fell to 5.63, closing at 5.71. Total volume amounted to 105,818.69 with $604,440.35 in turnover.
Structure & Formations
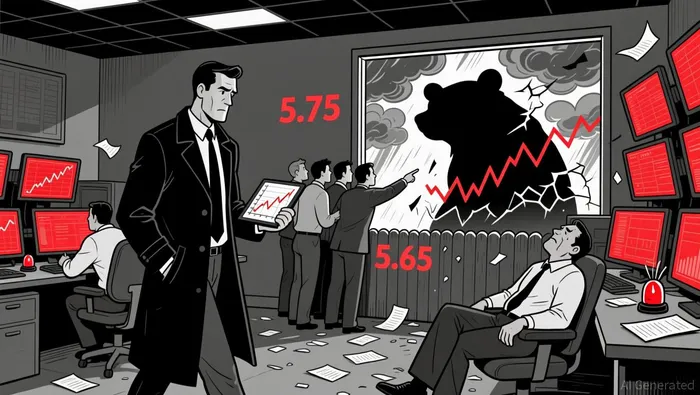
Price action displayed bearish engulfing patterns at key resistance levels, especially near 5.89 and 5.93, as well as a bear trap formation following a failed rebound above 5.84. A notable breakdown occurred at 5.75, confirming a shift in sentiment. Support levels at 5.75 and 5.65 were tested, with 5.65 showing early signs of consolidation.
Technical Indicators
The MACD remained bearish throughout the session, with a negative crossover and a declining histogram. RSI dipped into oversold territory near 30, suggesting potential for a short-term rebound. However, Bollinger Bands showed a significant expansion, indicating heightened volatility and a widening price range.
Volume & Turnover
Volume surged during the critical breakdowns below 5.75 and 5.65, confirming bearish momentum. Turnover also increased during these sessions, particularly after 20:00 ET on 2025-12-29 and into the early hours of 2025-12-30. Price and turnover aligned during these phases, adding strength to the bearish signal.
Fibonacci Retracements
On the 5-minute chart, price found resistance at the 38.2% retracement level (5.89) before breaking down. Daily retracements showed 5.75 as the 61.8% level of a prior bullish move, now acting as a pivot point. Price has since moved below this, suggesting a possible test of the 38.2% level at 5.58 if the downward trend continues.
Looking ahead, a rebound above 5.75 could indicate short-term stabilization, but a failure to hold above 5.65 would likely push the pair toward 5.58. Investors should remain cautious and watch for a possible divergence between price and RSI as an early warning sign of a reversal.
Decodificar los patrones del mercado y descubrir estrategias de trading rentables en el ámbito de las criptomonedas.
Latest Articles
Stay ahead of the market.
Get curated U.S. market news, insights and key dates delivered to your inbox.


Comments
No comments yet