
Market Overview for MovieBloc/Tether (MBLUSDT)
Summary
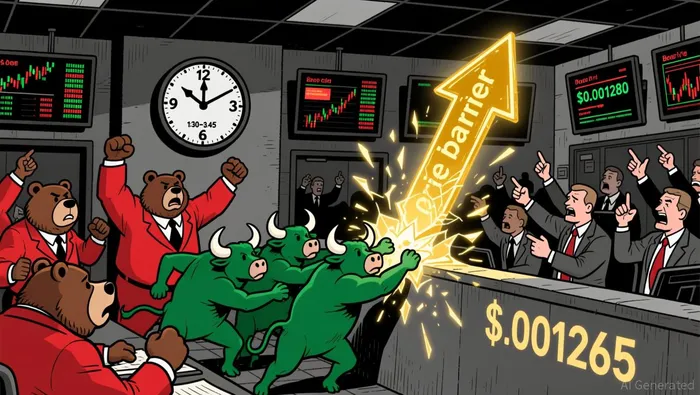
• Price consolidated near key support at $0.001265–0.001270 on fading momentum.
• Volume surged at $0.001280–0.001285 before retreating, hinting at failed resistance.
• RSI and MACD signaled bearish momentum with no immediate oversold conditions.
• Bollinger Band contraction suggests potential volatility breakout ahead.
• Fibonacci retracement at $0.001269–0.001271 may anchor next directional move.
24-Hour Performance
MovieBloc/Tether (MBLUSDT) opened at $0.001282 on January 17, 2026, at 12:00 ET, and traded between $0.001260 and $0.001287 over the next 24 hours, closing at $0.001264 as of January 18, 12:00 ET. Total volume was approximately 222,538,411.0, with a notional turnover of $286,168.15, reflecting elevated activity toward the opening and mid-session hours.
Structure and Key Levels
Price action showed several bearish engulfing patterns between 01:30 and 03:45 ET, confirming a shift in momentum. A strong support area emerged near $0.001265–0.001270, with multiple closes consolidating in this range. The initial resistance cluster at $0.001280–0.001285 saw several attempts to break through, but bearish pressure overcame those levels by early afternoon.
Moving Averages and Momentum
The 5-minute 20-period and 50-period moving averages remained bearishly aligned for most of the session, with price consistently closing below both. On the daily chart, the 50- and 200-period moving averages are in a neutral configuration, with no strong directional bias. RSI hovered around 45–50 through the session, indicating moderate bearish pressure without entering oversold territory. MACD remained negative and trending lower, suggesting continued caution on the downside.
Volatility and Bollinger Bands
Bollinger Bands showed a narrowing phase between 04:00 and 08:00 ET, suggesting a potential breakout period. Price traded within the lower third of the bands for much of the session, indicating subdued volatility. However, the recent contraction may precede a period of heightened price movement.
Volume and Turnover Analysis
Volume spiked during the early hours as price tested $0.001285, with strong bearish follow-through after 19:00 ET. Notional turnover increased during those hours, aligning with the bearish trend. A divergence between volume and price was observed in the final hour of the session, where volume declined while price continued to edge lower—suggesting possible short-term bottoming activity.
Fibonacci Retracement Levels
Applying Fibonacci retracement to the most recent 5-minute swing from $0.001275 to $0.001287, the 38.2% and 61.8% levels sit at $0.001279 and $0.001274, respectively. Price has bounced off the 61.8% level multiple times, indicating it may act as a short-term floor ahead.
Forward-Looking Observations
Price may test the $0.001260 level for support or rally back toward $0.001275 if short-term buyers emerge. However, without a breakout above $0.001278, bearish control appears intact. Traders should remain cautious ahead of potential volatility, particularly following the recent Bollinger Band contraction.
Decoding market patterns and unlocking profitable trading strategies in the crypto space
Latest Articles
Stay ahead of the market.
Get curated U.S. market news, insights and key dates delivered to your inbox.


Comments
No comments yet