
Market Overview for Movement/Tether (MOVEUSDT) on 2025-12-24
Summary
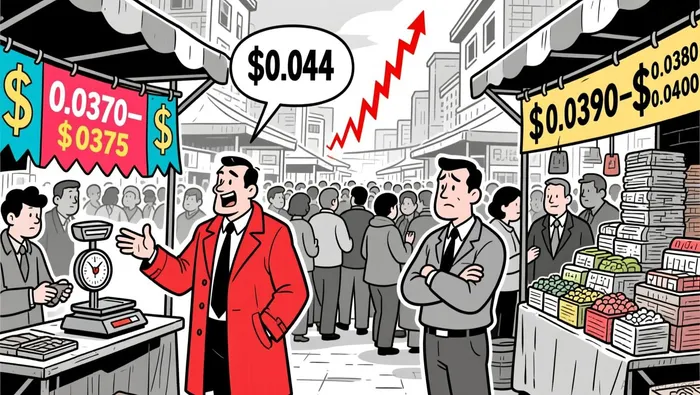
• Price surged from $0.0321 to $0.044, forming a bullish engulfing pattern near the session high.
• Volatility expanded sharply in the first half of the day, with turnover spiking above $25 million.
• Momentum diverged in late trading, with RSI nearing overbought levels and MACD showing bearish crossover.
Movement/Tether (MOVEUSDT) opened at $0.0321 on 2025-12-23 at 12:00 ET, hit a high of $0.044, and closed at $0.0381 by 12:00 ET on 2025-12-24. Total volume was 177,565,490.9 and turnover reached $6,539,571.50.
Structure & Formations
Price experienced a sharp upward move from $0.0321 to $0.044, with a bullish engulfing pattern forming at the high. A doji appeared near $0.0385, indicating indecision. Key support levels may form at $0.0370–$0.0375, while resistance appears to hold around $0.0390–$0.0400.
Moving Averages
On the 5-minute chart, the 20-period and 50-period moving averages crossed over, indicating a potential bearish turn in late trading. Daily MA levels suggest a continuation of short-term bullish momentum but remain below the 200-period line, suggesting medium-term uncertainty.
MACD & RSI
Momentum accelerated during the sharp rally but has since weakened, with the MACD line crossing below the signal line. RSI approached overbought territory at 72 but failed to sustain a strong move higher, raising the possibility of a near-term pullback.Bollinger Bands
Volatility expanded significantly between 08:00 and 10:00 ET, with price reaching the upper band of Bollinger Bands. By 16:00 ET, price had fallen closer to the lower band, indicating a potential consolidation phase.
Volume & Turnover
Trading volume peaked at 27,421,122.6 at 09:30 ET, coinciding with the high of $0.044. Notional turnover also surged to $1,196,894.6 at 11:45 ET, though price failed to respond with a sustained move higher, suggesting some profit-taking or short-term profit lock-in.
Fibonacci Retracements
From the key 5-minute swing high of $0.044 to the low of $0.0321, 61.8% retracement levels coincide with the 0.0385–0.0390 range. Price is now consolidating near the 38.2% retracement level, suggesting possible sideways movement ahead.
The market appears to be in a consolidation phase after a strong bullish reversal, but divergences in momentum and volume suggest caution. A close below $0.0370 could signal a near-term correction, but a breakout above $0.0400 would re-ignite bullish momentum. Investors should remain cautious for potential volatility in the next 24 hours.
Decoding market patterns and unlocking profitable trading strategies in the crypto space
Latest Articles
Stay ahead of the market.
Get curated U.S. market news, insights and key dates delivered to your inbox.


Comments
No comments yet