
Market Overview for Metis/Tether (METISUSDT) on 2026-01-03
Summary
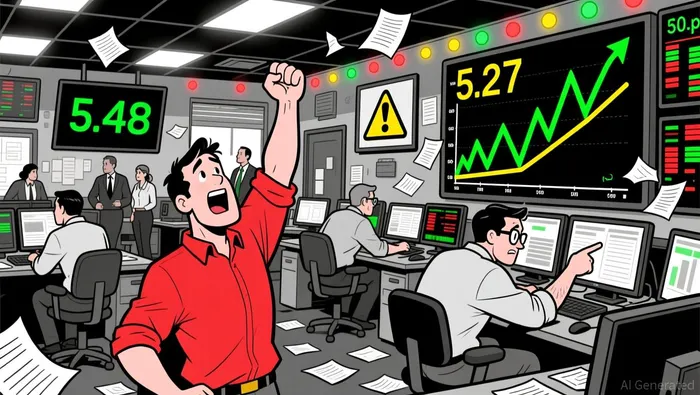
• Price action formed a bullish breakout above 5.27, with a 12.5% daily gain and key resistance at 5.48 tested.
• RSI showed overbought conditions near 75, suggesting a possible pullback or consolidation phase.
• Volume and turnover spiked during the late-night rally, confirming the strength of the upward move.
• A 5-minute bearish engulfing pattern emerged after 5.48, hinting at short-term profit-taking.
• Volatility expanded significantly after 03:30 ET, as price moved beyond upper Bollinger Bands.
At 12:00 ET on 2026-01-03, Metis/Tether (METISUSDT) opened at $5.17, traded between $5.15 and $5.48, and closed at $5.2. Total volume reached 46,563.142, with a notional turnover of $241,987.80 over the 24-hour period.
Structure & Formations
Price broke out from a consolidative range between 5.17 and 5.27, pushing higher with a strong bullish bias. A 5-minute bearish engulfing pattern emerged at the session high of 5.48, suggesting potential short-term profit-taking. Key support levels were identified at 5.27 and 5.2, while 5.48 served as a major resistance.
Moving Averages and MACD
On the 5-minute chart, the 20 and 50-period moving averages were trending upwards, with the 50 crossing above the 20 to confirm the bullish momentum. The MACD histogram showed a sharp expansion during the late-night rally, indicating strong accumulation.
Relative Strength Index (RSI)
The 14-period RSI climbed to 76, signaling overbought conditions and suggesting the market may be due for a pullback or consolidation.
Bollinger Bands and Volatility
Volatility expanded significantly after 03:30 ET, pushing price above the upper Bollinger Band. This expansion confirmed the strength of the move but also hinted at an overextended price level.
Volume and Turnover
Volume surged during the late-night rally, particularly between 03:30 and 05:00 ET, confirming the strength of the upward move. Turnover mirrored the volume increase, with the largest single 5-minute turnover occurring at 05:30 ET during a sharp decline from 5.32 to 5.30.
Fibonacci Retracements
Fibonacci levels applied to the recent swing high (5.48) and low (5.15) showed 61.8% at 5.29 and 38.2% at 5.34. Price appears to have bounced from the 5.27 level, suggesting a possible retest of the 5.34 level before the next move.
Looking ahead, a pullback to test the 5.27–5.29 range may occur if RSI remains overbought and the bearish engulfing pattern at 5.48 gains traction. Investors should remain cautious of potential short-term corrections but note the overall bullish bias.
Descifrar los patrones de mercado y desarrollar estrategias de negociación rentables en el ámbito de las criptomonedas.
Latest Articles
Stay ahead of the market.
Get curated U.S. market news, insights and key dates delivered to your inbox.

AInvest
PRO
AInvest
PRO
Comments
No comments yet