
Market Overview for Memecoin/Tether (MEMEUSDT): December 30, 2025
Summary
• Price consolidated near $0.000973–$0.000965 range, with a failed breakout above $0.000975.
• RSI signaled overbought conditions in early ET hours, followed by a pullback.
• Volume and turnover diverged in late ET, suggesting weakening conviction.
24-Hour Market Overview
At 12:00 ET–1 on 2025-12-29, Memecoin/Tether (MEMEUSDT) opened at $0.000972 and traded to a high of $0.000981 and a low of $0.000948 before closing at $0.000971 at 12:00 ET on 2025-12-30. Total volume was approximately 326,714,390 and notional turnover reached $313,517.62 during the 24-hour period.
Structure & Candlestick Patterns
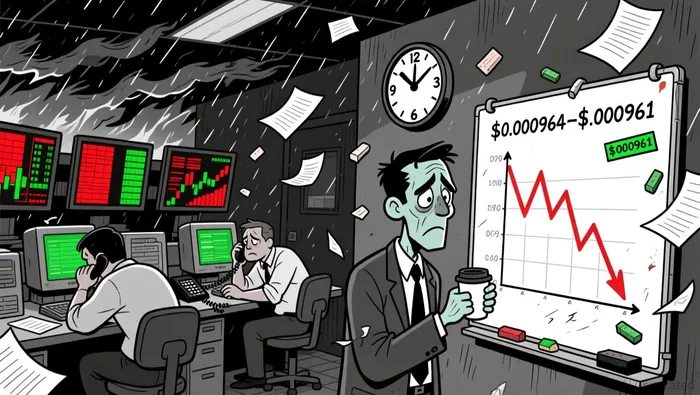
Price action showed a bearish engulfing pattern near $0.000976–$0.000974 at 18:30 ET, followed by a long lower shadow at $0.000964–$0.000961 around 01:15 ET, hinting at temporary bearish rejection and a possible short-covering bounce. A doji formed near $0.000964 at 01:15 ET, signaling indecision.
Moving Averages
On the 5-minute chart, price oscillated around the 20SMA and 50SMA, with no clear directional bias. On the daily chart, the 50DMA and 100DMA aligned closely in the $0.000965–$0.000970 range, suggesting a possible consolidation phase.
Momentum Indicators (MACD & RSI)
The RSI reached overbought territory (above 65) around 19:00 ET, then dropped sharply below 50 by 03:00 ET, indicating bearish momentum. The MACD remained below zero, with the signal line crossing it on the downside in the early hours, reinforcing bearish bias.
Bollinger Bands
Price traded within a moderate volatility range, with Bollinger Bands widening slightly during the morning ET hours. Price tested the lower band at $0.000961–$0.000963, suggesting potential support but failed to show a convincing rebound.
Volume & Turnover
Volume spiked above $0.000974–$0.000976 in the early hours of ET, but turnover lagged, indicating potential divergence. The largest turnover occurred at 01:15 ET near $0.000964, with a smaller volume footprint despite a strong move lower.
Fibonacci Retracements
A recent 5-minute swing from $0.000948 to $0.000981 showed price pausing at the 61.8% retracement level ($0.000965) before drifting lower, suggesting a potential short-term floor. Daily Fibonacci levels aligned with the 50DMA as a potential support zone.
Looking ahead, price could test the $0.000965–$0.000962 range for a possible bounce or break below $0.000960, which could signal a deeper correction. Investors should monitor volume and divergence in the next 24 hours for confirmation of directional bias.
Decodificar los patrones del mercado y desarrollar estrategias de negociación rentables en el ámbito de las criptomonedas.
Latest Articles
Stay ahead of the market.
Get curated U.S. market news, insights and key dates delivered to your inbox.


Comments
No comments yet