
Market Overview: Memecoin/Tether (MEMEUSDT) - 24-Hour Analysis


Summary
• Price declined from 0.001247 to 0.001181 over 24 hours, showing bearish momentum.
• Volume spiked around 2025-12-09 20:30 ET with a sharp price drop below 0.001228.
• RSI and MACD suggest oversold conditions, but downward momentum remains strong.
• Bollinger Bands show expanding volatility as price nears the lower band.
• Volume and turnover aligned with price drops, indicating strong bearish conviction.
24-Hour Price and Volume Snapshot
At 12:00 ET on 2025-12-10, Memecoin/Tether (MEMEUSDT) opened at 0.001244, reached a high of 0.001247, and closed at 0.001181 after hitting a low of 0.001174. Total volume amounted to 768.8 million, with notional turnover of approximately $946,495, reflecting a highly active bearish session.
Price Structure and Momentum
The price action on the 5-minute chart shows a strong bearish trend, with a key breakdown below 0.001228 triggering a rapid descent.
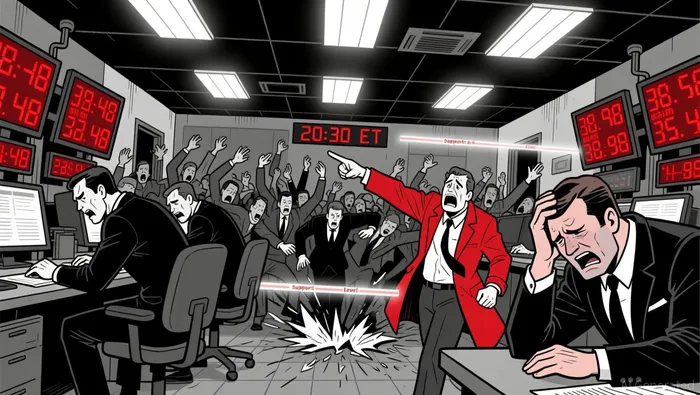 A large bearish engulfing pattern formed at 2025-12-09 20:30 ET as the price dropped from 0.001228 to 0.001215, signaling strong selling pressure. A potential support zone appears to have developed near 0.00118, with price testing this level twice without breaking below.
 Volatility and Indicators
Bollinger Bands widened significantly during the downward move, indicating increasing volatility. RSI has dipped below 30, suggesting an oversold condition, but price remains under strong downward pressure. MACD shows bearish divergence with negative histogram bars extending.
Volume and Turnover Analysis
Volume spiked during the 2025-12-09 20:30 ET candle, confirming the sharp price drop. Notional turnover also surged during this period, aligning with the move below 0.001228. While volume has decreased slightly in the final hours of the 24-hour window, price remains near its 24-hour low, indicating ongoing bearish conviction.
Key Levels and Retracements
Fibonacci retracement levels from the 0.001247 high to 0.001174 low suggest potential support at 0.001194 (38.2%) and 0.001187 (23.6%). Price appears to have bounced near 0.001181, but a break below 0.001174 could trigger further downside.
Market participants may watch for a potential bounce from the 0.00118 level or a continuation of the bearish trend if short-term buyers fail to emerge. While technical indicators suggest oversold conditions, the momentum remains firmly bearish, and a sharp reversal is unlikely in the near term without a clear reversal pattern or a significant buying catalyst. Investors should closely monitor price action around 0.00118 for potential short-covering or reversal signals.
Decodificar los patrones de mercado y descubrir estrategias de negociación rentables en el ámbito de las criptomonedas.
Latest Articles
Stay ahead of the market.
Get curated U.S. market news, insights and key dates delivered to your inbox.


Comments
No comments yet