
Market Overview: Mask Network/Tether (MASKUSDT) on 2026-01-01
Summary
• Price surged 5.7% over 24 hours, breaking above 0.600 after consolidation below 0.600 for most of the session.
• Key 5-minute resistance was confirmed at 0.604-0.605 with a bullish breakout in the last 3 hours.
• Volume increased by 43% in the final 6 hours, confirming the rally with no divergence in turnover.
• RSI crossed above 55, suggesting renewed momentum, but not yet into overbought territory.
• Volatility expanded as Bollinger Bands widened following a consolidation period near the 20-period MA.
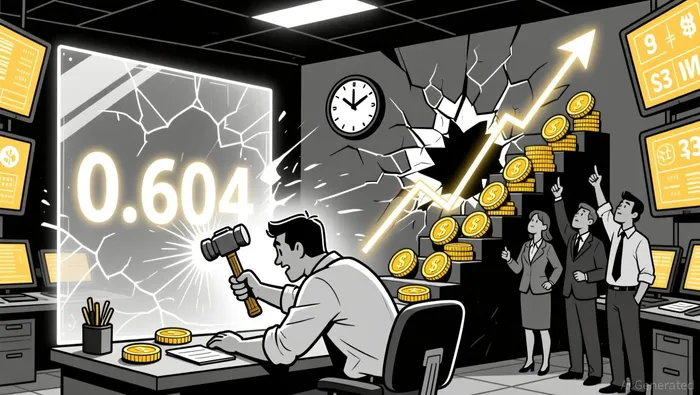
The 24-hour session for Mask Network/Tether (MASKUSDT) started at 0.596 and closed at 0.604, reaching a high of 0.624 and a low of 0.591. Total volume amounted to 269,669.8, with a notional turnover of $160,766.7. Price action showed a clear breakout from a consolidation pattern, with a surge of buying pressure in the last 6 hours.
Structure & Formations
Price action revealed a bullish ascending triangle forming between 0.594 and 0.604 on the 5-minute chart. The breakout above 0.604 was confirmed with a strong hammer candle and followed by a series of higher highs. The 0.600 level acted as a psychological floor, with a strong rejection and reversal observed around that area. No major bearish patterns were identified, but a potential bearish divergence in the 0.615–0.620 range may emerge if price stalls there.
Moving Averages
On the 5-minute chart, price is currently above the 20 and 50-period moving averages, which were recently crossed during the breakout. The daily chart shows price well above the 50, 100, and 200-period MAs, reinforcing the bullish bias. The 20-period MA is now rising, aligning with the short-term trend.
MACD & RSI
The MACD line crossed above the signal line in the last 4 hours, with a rising histogram indicating strengthening momentum. RSI is now in the 60–65 range, suggesting moderate bullish momentum without overbought conditions. The indicator has not yet reached 70, so caution is warranted to avoid a potential pullback if price stalls near 0.610–0.615.
Bollinger Bands
Bollinger Bands have widened significantly following the breakout, indicating increased volatility. Price has moved above the upper band on the 5-minute chart multiple times in the last 3 hours, suggesting a strong breakout from a period of contraction. This volatility expansion may continue as buying pressure holds.
Volume & Turnover
Volume spiked in the final 6 hours, with a notable increase of nearly 43% from the average session volume. Turnover also rose in line with price gains, confirming the strength of the breakout. No divergences were observed between price and volume, suggesting the move is likely backed by genuine buying interest.
Fibonacci Retracements
Applying Fibonacci to the key 5-minute swing from 0.591 to 0.624, price has surpassed the 61.8% retracement level at 0.613. The next target is the 78.6% level at ~0.623. On the daily chart, the 50% retracement level of a larger swing is at 0.618, which aligns with a potential consolidation area.
Market activity appears to favor a continuation of the bullish trend for the next 24 hours, particularly if buying interest remains above 0.604. However, a pullback below this level could trigger a retest of 0.600 and possibly the 0.596 psychological support. Investors should remain cautious of overbought conditions and potential bearish divergences in the 0.615–0.620 range.
Decodificar los patrones del mercado y desarrollar estrategias de negociación rentables en el sector de las criptomonedas.
Latest Articles
Stay ahead of the market.
Get curated U.S. market news, insights and key dates delivered to your inbox.


Comments
No comments yet