
Market Overview for Loopring/Tether (LRCUSDT)
Summary
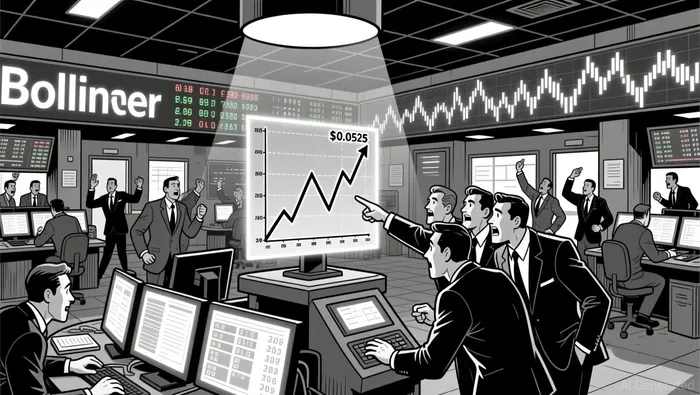
• Price formed key support at $0.0525 and tested resistance at $0.0535 in a 24-hour range-bound pattern.
• Volume surged near $0.0525 but failed to confirm a bullish breakout, indicating bearish control.
• RSI signaled overbought conditions briefly, followed by a retest of key levels, showing indecision.
• Volatility increased during afternoon hours, with Bollinger Bands widening around key support.
• Fibonacci 38.2% retracement at $0.0529 acted as minor resistance during the rebound attempt.
The Loopring/Tether pair (LRCUSDT) opened at $0.0537 on 2025-12-28 at 17:00 ET and closed at $0.0526 as of 2025-12-29 at 12:00 ET. The 24-hour high was $0.0539, and the low reached $0.0518. Total volume traded amounted to approximately 11.2 million tokens, with a notional turnover of $595,700.
Structure & Key Levels
The price remained largely within a defined range between $0.0518 and $0.0539, with $0.0525 serving as a critical support level and $0.0535 as a key resistance. A bearish engulfing pattern formed near $0.0535 on 2025-12-28, suggesting a shift in sentiment.
Moving Averages and Momentum
On the 5-minute chart, the 20-period and 50-period moving averages crossed multiple times, indicating a churning market with no clear trend. MACD lines showed alternating bullish and bearish momentum, while RSI reached overbought levels before retracting sharply, pointing to potential exhaustion on the buy side.
Volatility and Volume
Bollinger Bands expanded in the late afternoon and evening hours, suggesting rising volatility. Notably, volume increased near key support levels, but the lack of a decisive rebound suggests bearish control. Price-volume divergence was observed near $0.0525, with volume peaking on downward moves.
Fibonacci and Retracements
Fibonacci retracement levels from the recent swing high at $0.0539 to the low at $0.0518 showed the 38.2% level at $0.0529 and 61.8% at $0.0522. The 61.8% level held firm overnight, preventing a further decline.
The market appears to be consolidating ahead of a potential breakout, with $0.0525 acting as a psychological floor. A test of this level again may trigger a short-term bounce, but bearish momentum remains intact. Traders should remain cautious in the next 24 hours as any breakout attempt could face immediate countertrend pressure.
Decodificar los patrones del mercado y desarrollar estrategias de negociación rentables en el sector de las criptomonedas.
Latest Articles
Stay ahead of the market.
Get curated U.S. market news, insights and key dates delivered to your inbox.


Comments
No comments yet