
Market Overview for Kyber Network Crystal v2/Tether (KNCUSDT)


Summary
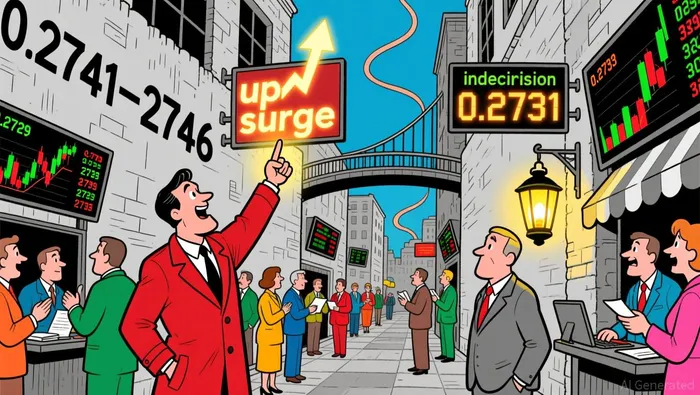
• KNCUSDT consolidates between 0.2714 and 0.2746, with a bullish engulfing pattern forming at 0.2739.
• RSI indicates moderate momentum, while Bollinger Bands show narrowing volatility.
• Turnover spikes at 14:30 ET, but price failed to break above 0.2741, signaling potential resistance.
Kyber Network Crystal v2/Tether (KNCUSDT) opened at 0.2714 on 2025-12-05 at 12:00 ET, reaching a high of 0.2746 and a low of 0.2683, before closing at 0.2724 on 2025-12-06 at 12:00 ET. Total 24-hour volume amounted to 412,441.0 with a turnover of approximately $112,740.
Structure & Formations
KNCUSDT showed consolidation within a defined range over the 24-hour period. Key support levels appear to form around 0.2714–0.2721, with a recent bullish engulfing pattern observed at 0.2739. A doji near 0.2731 also suggests indecision among traders at that level. Resistance appears to be testing at 0.2741–0.2746, with several failed attempts to push above this threshold.
Moving Averages
On the 5-minute chart, the 20-period moving average is slightly above the 50-period, suggesting short-term bullish momentum. The 50-period line, however, remains below the current price, indicating moderate strength. Over the daily timeframe, the 50-period MA is below the 100 and 200-period lines, suggesting a neutral-to-bearish trend in the broader time frame.
MACD & RSI
MACD remains in positive territory, suggesting ongoing buying pressure, but RSI remains within a neutral range (45–55), indicating neither overbought nor oversold conditions. A recent divergence between rising RSI and a flat price action at 0.2735–0.2731 hints at potential bearish pressure forming.
Bollinger Bands
Bollinger Bands have shown a recent contraction, particularly between 0.2729 and 0.2733, signaling a period of low volatility. Price remained within the band’s range without touching either extreme, suggesting a continuation of consolidation. A breakout from this range may follow if volume increases meaningfully.
Volume & Turnover
Volume peaked at 14:30 ET with 41,244.1 trades, yet the price failed to break above 0.2741, suggesting a potential lack of conviction. Turnover spiked alongside this volume but did not drive a sustained move. A divergence between volume and price during the morning session suggests cautious participation.
Fibonacci Retracements
On the 5-minute chart, the 38.2% Fibonacci retracement level is at 0.2726, where the price has paused multiple times. The 61.8% level at 0.2736 has acted as a key resistance zone. Over the daily timeframe, a retracement from the recent high to 0.2739 appears to be forming, aligning with prior resistance levels.
KNCUSDT may test 0.2741 for a breakout or consolidation within 0.2714–0.2739 over the next 24 hours. Investors should monitor volume and RSI for signs of momentum shifts. As with all market movements, volatility and divergence between price and indicators could signal a reversal at any time.
Decoding market patterns and unlocking profitable trading strategies in the crypto space
Latest Articles
Stay ahead of the market.
Get curated U.S. market news, insights and key dates delivered to your inbox.


Comments
No comments yet