
Market Overview for Kusama/Tether (KSMUSDT)


Summary
• KSMUSDT formed a bearish engulfing pattern near 8.24, signaling potential near-term reversal.
• Price consolidated between 8.13 and 8.21, with volume dipping below average during key consolidation phases.
• RSI showed overbought conditions early, then fell into oversold territory near 8.10, reflecting mixed momentum.
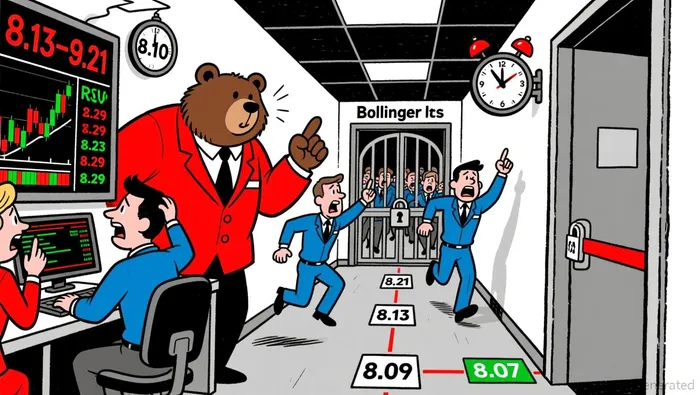
• Bollinger Bands narrowed during quiet hours before expanding with a sharp rebound toward 8.23.
• Turnover spiked during 18:15–18:30 ET, but failed to drive a sustained breakout above 8.22.
Kusama/Tether (KSMUSDT) opened at 8.24 on December 5 at 12:00 ET and traded between 8.11 and 8.29 before closing at 8.15 on December 6 at 12:00 ET. The 24-hour volume totaled 57,038.63 KSM, with a notional turnover of $459,868.
Structure & Formations
Price formed a bearish engulfing candle at 8.24–8.17, reinforcing resistance at 8.22–8.23. A 5-minute doji near 8.21 hinted at indecision, while a bullish pinbar at 8.13–8.17 suggested support in that range.
Moving Averages
On the 5-minute chart, price closed below the 20-period and 50-period moving averages, indicating bearish bias. The daily chart shows the 50-period MA above the 100- and 200-period lines, suggesting a mixed medium-term outlook.
Momentum and Volatility
MACD crossed into negative territory, aligning with bearish momentum. RSI dipped below 30, hinting at oversold conditions. Bollinger Bands contracted during overnight hours, followed by a sharp retest of the upper band near 8.22.
Volume and Turnover
The largest volume spike occurred during 18:15–18:30 ET, with 2,820.12 KSM traded, but the price failed to break above 8.23. Turnover was concentrated in the 18:00–20:30 ET window, suggesting active participation during that period.
Key Levels and Fibonacci
Support levels appear at 8.13 (tested twice), 8.09 (recent low), and 8.07 (initial Fibonacci retracement). Resistance is likely at 8.21–8.23 and 8.25–8.29, with 8.23 forming a 61.8% retracement of the recent downwave.
The next 24 hours may see a test of 8.23–8.25 for a potential bounce or a pullback to retest 8.13–8.15. Investors should remain cautious of low volume, which could limit strong directional moves.
Decoding market patterns and unlocking profitable trading strategies in the crypto space
Latest Articles
Stay ahead of the market.
Get curated U.S. market news, insights and key dates delivered to your inbox.


Comments
No comments yet